Python scripts running in EnSight can be more difficult to debug than command files as the built-in debugger does not work with the Python scripts. Moreover, EnSight uses Python heavily internally which can make it difficult to pick specific scripts/modules to debug. The work-around is to use external Python debuggers such as Visual Studio Code. The EnSight distribution includes the 'ptvsd' module to simplify the use of Visual Studio and Visual Studio Code as external debuggers.
To connect to an external Python debugger using ptvsd, one only needs to run the following Python snippet in the EnSight command dialog or in a user Python script:
import ptvsd
ptvsd.enable_attach(address=('0.0.0.0', 5678))
ptvsd.wait_for_attach()
EnSight will block, waiting for an external debugger (e.g. Visual Studio or Visual Studio Code) to attach.
To use the Python debugger with Visual Studio Code, you first need to add a Python debug attach configuration. Something like this will work with the above example:
{
"version": "0.2.0",
"configurations": [
{
"name": "Python Attach (local)",
"type": "python",
"request": "attach",
"port": 5678,
"host": "127.0.0.1"
}
]
}
Using the simple script:
import ptvsd
ptvsd.enable_attach(address=('0.0.0.0', 5678))
ptvsd.wait_for_attach()
for i in range(1000):
print(i)
We load the script source into the EnSight Python editor and into Visual Studio Code. We also set a breakpoint on the print() line.
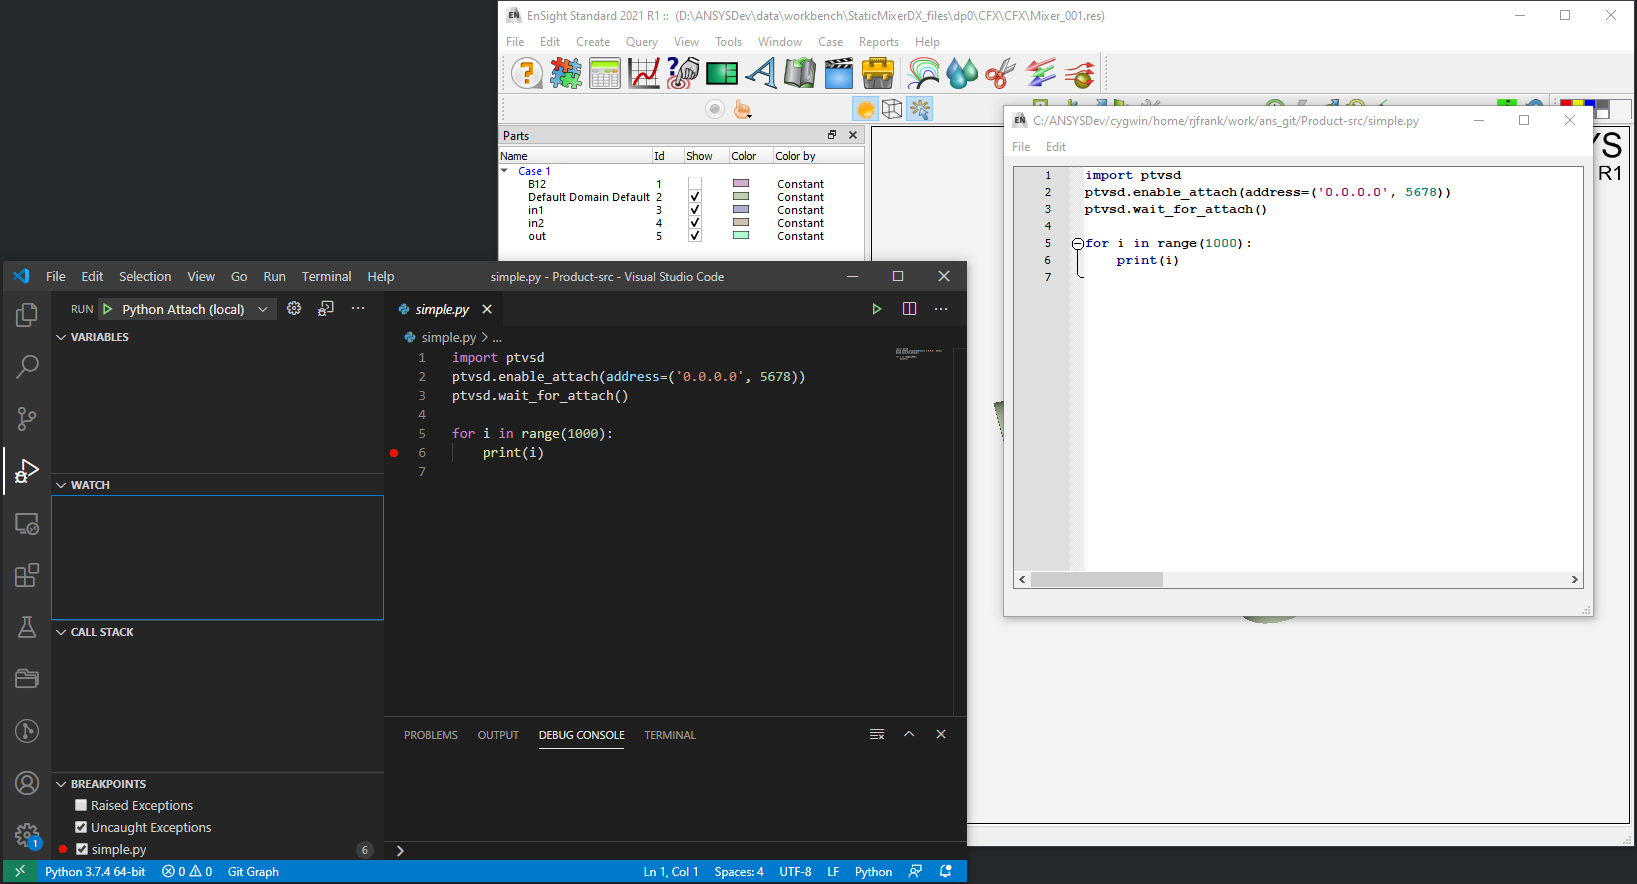
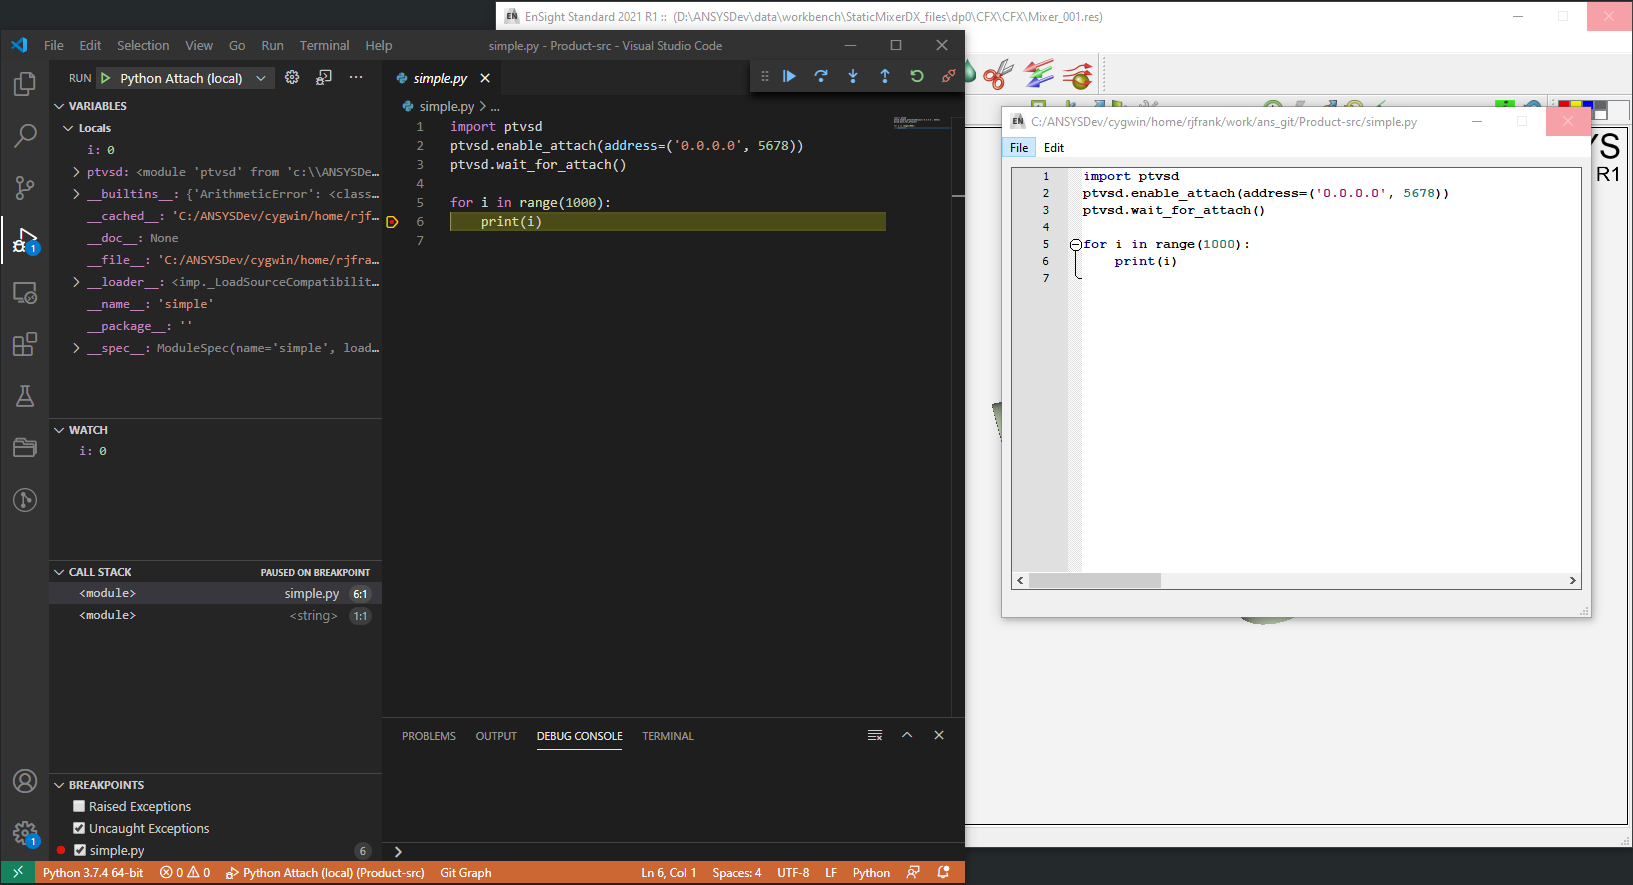
Now, from EnSight import the file as a module. EnSight will hang. Use the Python attach (local) option in Visual Studio Code to attach to EnSight and you will see the debugger stop at the breakpoint and debugging can proceed.
The same operation can be performed using Visual Studio as the debugging host.
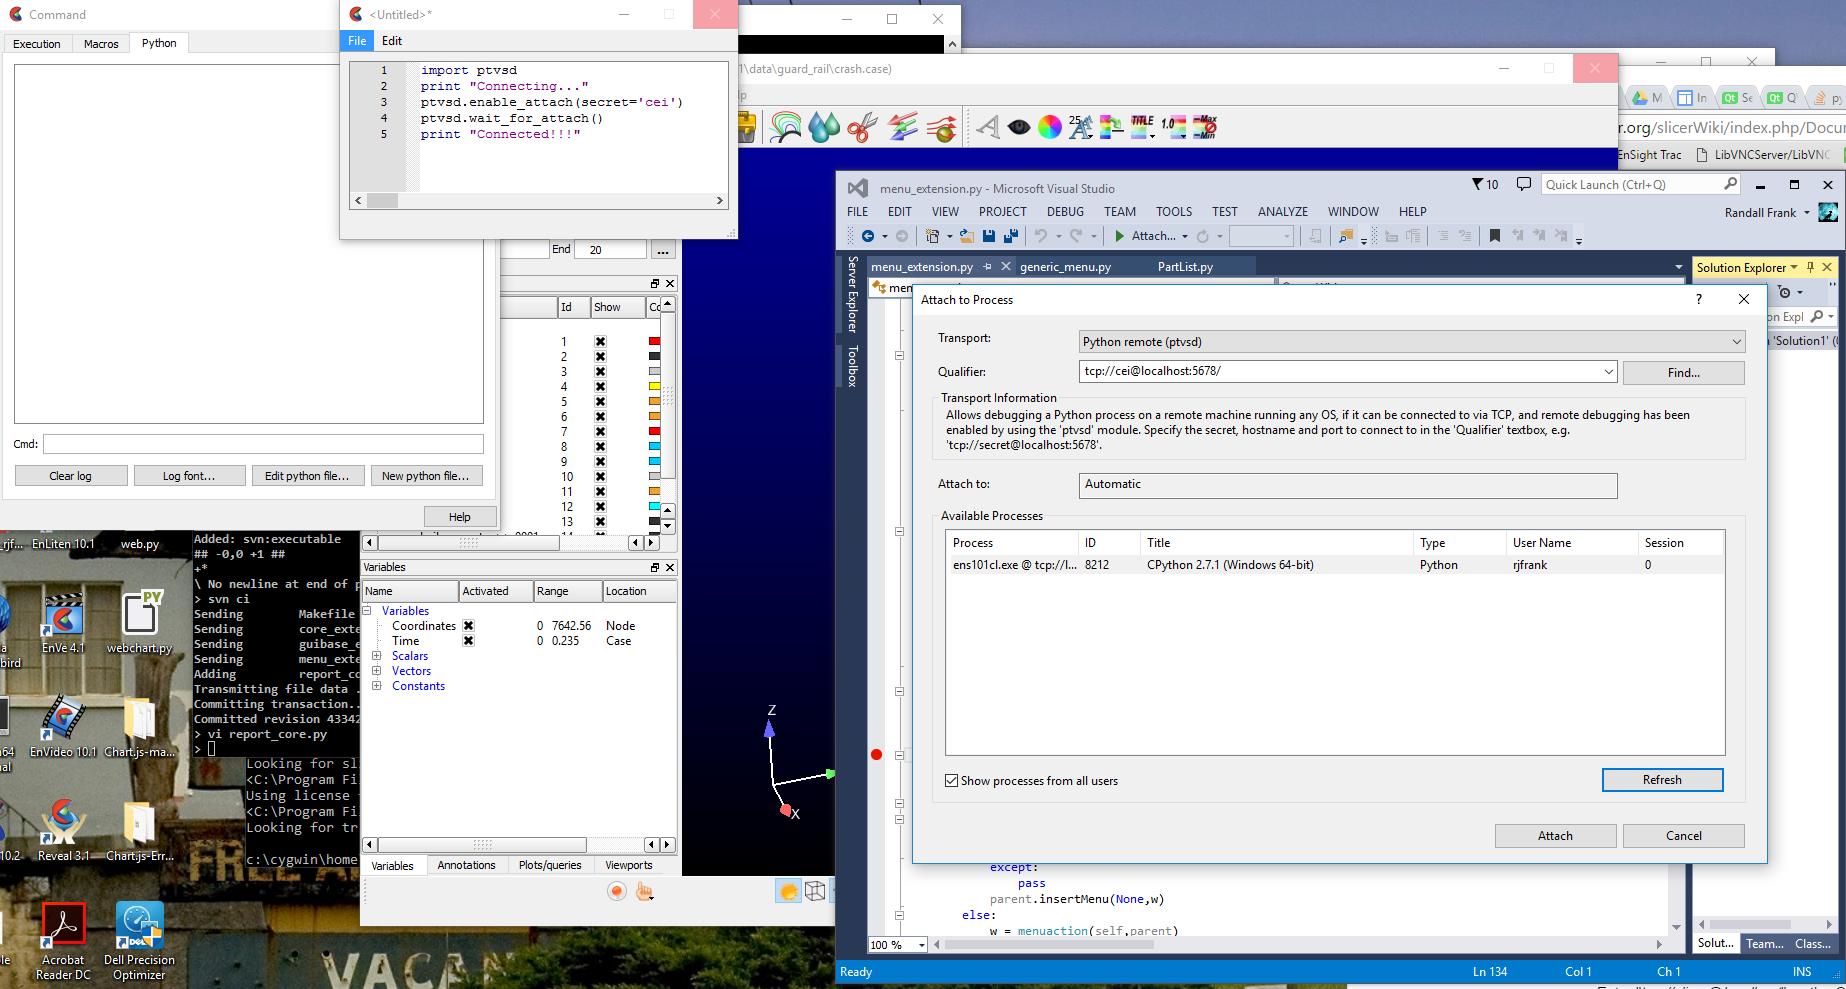
After clicking attach in VS, we are live. Note: I put a breakpoint in getWidget() in menu_extension.py so on a RMB down in EnSight, we get this:
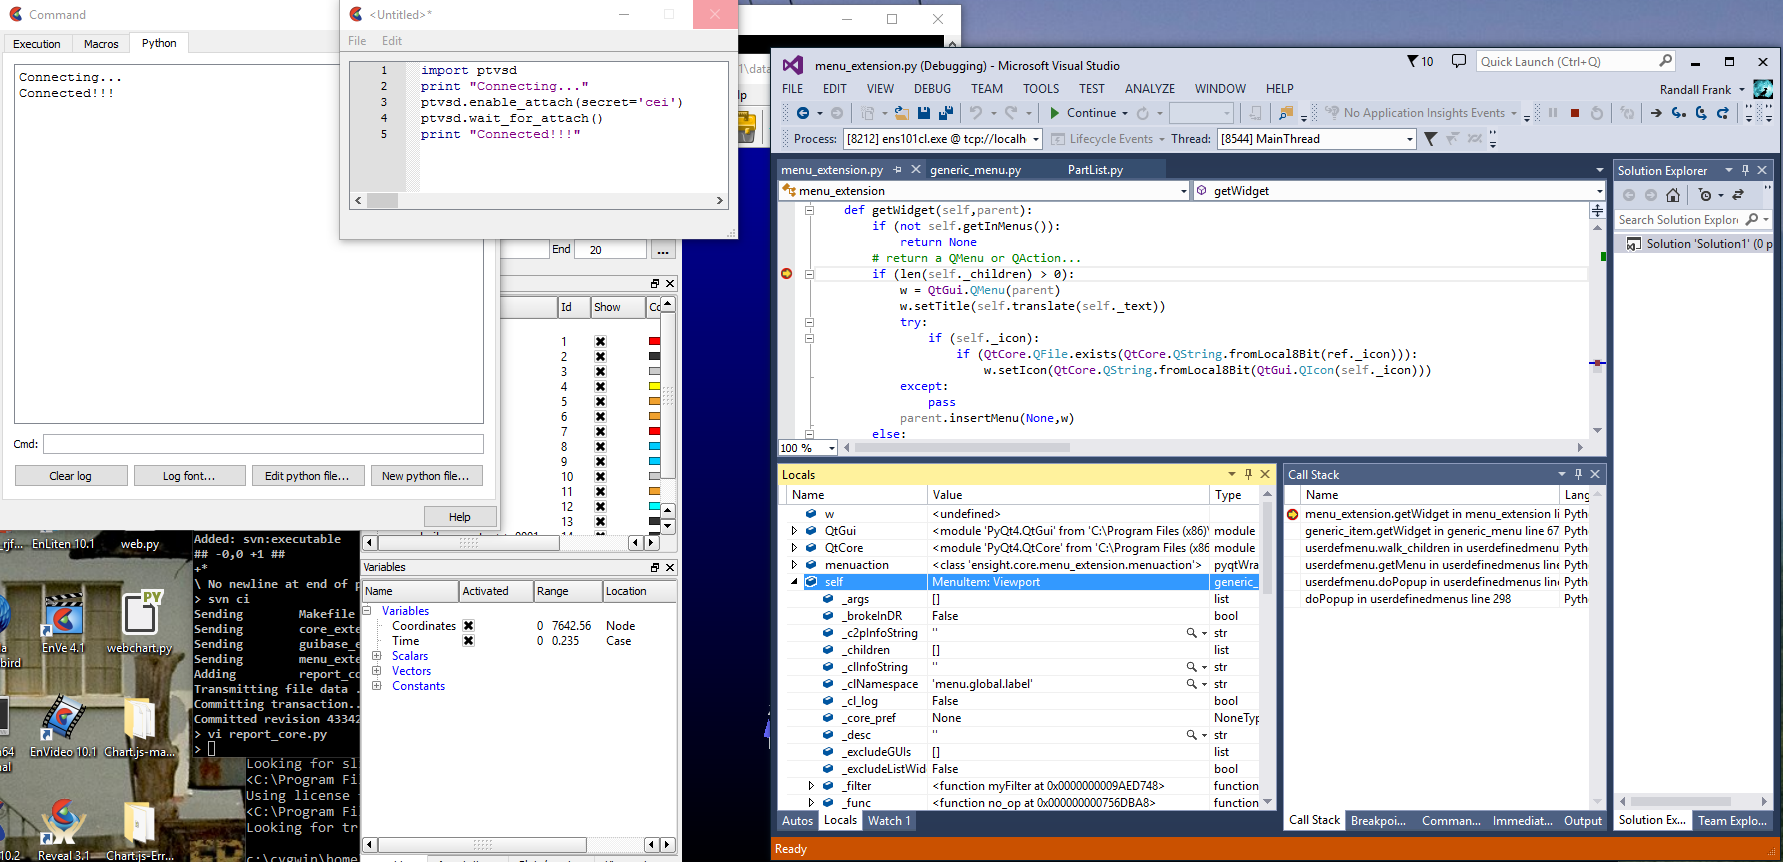
Variable view/edit, breakpoints exception trapping, etc. Pretty much everything you need to debug Python code running in EnSight.
If you have installed the debugger tool, you can start a new debugging session by:
A more advanced script can be seen here:
import ptvsd
#
# import this file, do not exec it so that the
# debugger can find the source code
#
if not ptvsd.is_attached():
# at this point, EnSight will "hang" until VS is
# attached to the session
ptvsd.enable_attach(secret='cei')
ptvsd.wait_for_attach()
print("Here we go")
for i in range(100):
if i == 50:
# an example of a code triggered break point
ptvsd.break_into_debugger()
print("Number= {}".format(i))