Currently the EnSight query over time works either for XYZ, Node ID or Element ID over time for one value. This means that you
This tool attempts to automate the task of querying through time. It makes a query over time using a list of node ids, element ids AND/OR xyz coordinate triplets. The tool currently allows two variables: one elemental and one nodal in which the variables can be a scalar variable or a vector variable component (magnitude, x, y, or z). The tool is located in the User Defined Tools: Analyze folder.
The lists of node ids, element ids and/or coordinate xyz triplets can be typed in as space or comma delimited values in the field, or the "Browse" button can be pressed to select a file which contains the values. Every three xyz values is considered a coordinate.
The tool then gets the value of the variables from start time step to end time step and creates a query from each variable for each element id for each node id and for each xyz triplet.
Finally, query none is chosen at the end to turn off querying.
Note that this should work when you try to replay a command file, but will not work using a save/restore context.
Element and / or Node id (integer) or filename containing space, tab, or comma delimited integers
XYZ coordinates (floating x 3), or a filename containing space, tab, or comma delimited floating point triplets
(three coordinates for each XYZ location).
Elemental variable from pulldown list
Nodal variable from pulldown list
Start time step (integer)
End time step (integer)
Scalar or Vector variable (pulldown list of names)
if either variable is a vector, then enter component (pulldown M, X, Y, or Z), otherwise not used
Plot flag (True will make a plot for each variable)
One query at a given (node id, element id or coordinate xyz) representing the value of the given scalar or vector variable component over time and optionally, the queries are collected and plotted together in logical fashion as follows.
Example
So if three node ids are entered, four element ids, and 5 XYZ coordinate triplets (XYZ entered as 15 floating point values or a filename containing 15 floating point values) are entered, and two variables are chosen, one nodal and one elemental, then 17 queries will be created:
three nodal queries representing the nodal variable values at the three node ids over time,
four elemental queries representing the elemental variable values at the four element ids over time,
and five xyz queries representing the nodal variable values at the five xyz locations over time,
and five xyz queries representing the elemental variable values at the five xyz locations over time.
Optional: plot the query. If the toggle is ON, then four plots will be created.
Note that if you choose to run the query tool again on different variables then the curves on the plots will have their colors, their line style, and their markers match consistently with the previous plots, using metadata assigned to the curves and the plots.
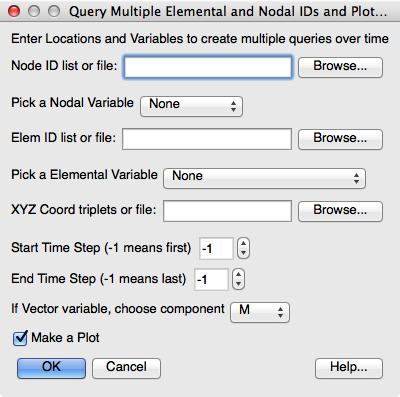
Note the GUI shown below for a transient dataset with elemental and nodal variables, with static geometry.
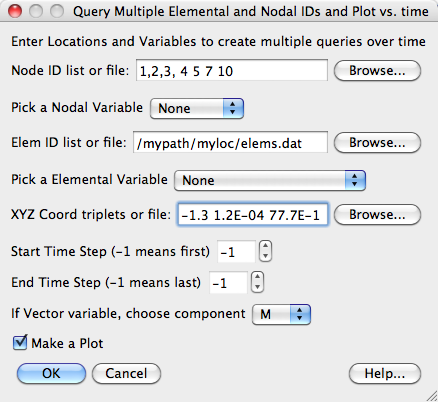
Note the GUI with sample data entry which is typed in for Node IDs, and XYZ locations, but is a filename for the Element IDs as below. Variables have not yet been selected in this GUI.
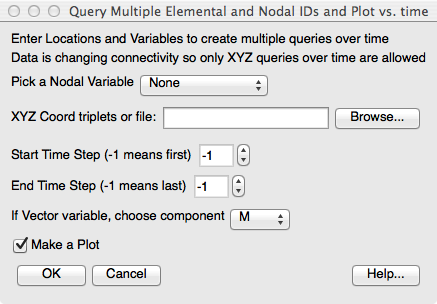
Note that if the geometry is changing connectivity, then only XYZ query over time is allowed, and the GUI will not include a nodal or elemental id query option. Note also if there are no nodal variables, then the nodal option will not be in the GUI. And similarly the GUI will not include the option to query elemental IDs if there are no elemental variables.
For example, if the dataset is changing connectivity and only has nodal variables, you will get the following limited GUI with a nice warning at the top. This prevents users from trying to query nonsense because the changing connectivity geometry id locations may be changing unpredictably in the geometry.
Meta data is used on both the plots and the queries created by this tool to allow smart processing of curves and plots and to avoid inadvertently changing plots or queries not created by the tool. For example, subsequent curves created with the same node id will all be colored the same, have the same marker, and have the same linestyle for consistent and easy interpretation.
Metadata can allow easy selection of all the queries created with this tool, for example to export them into files.
Plots created by this tool have a metatag whose value is 1. This allows the tool to quickly cull the list of plots to only those previously created by the tool.
{'QPT_plot': 1}
Queries (curves) created by this tool have the following metatags whose values are strings:
QPT_type = what kind of query 'Node_ID' or 'Element ID' or 'XYZ'
QPT_var = name of var
QPT_comp = variable component ('M', or 'X' or 'Y' or 'Z')
QPT_loc = node or element ID, or xyz triplet string
This curve was created at node id 4, using the magnitude of variable named 'U'
{'QPT_type': 'Node ID', 'QPT_var': 'U', 'QPT_comp': 'M', 'QPT_loc': '4'}
This curve was created at element id 264, using the variable named 'S_MISES', which since it's a scalar, doesn't use the component 'M'.
{'QPT_type': 'Element ID', 'QPT_var': 'S_MISES', 'QPT_comp': 'M', 'QPT_loc': '264'}
This curve was created at XYZ location 1.5792e+03,-5.0000e+01,-4.2499e+00, using the variable named 'S_MISES', which since it's a scalar, doesn't use the component 'M'.
{'QPT_type': 'XYZ', 'QPT_var': 'S_MISES', 'QPT_comp': 'M', 'QPT_loc': '1.5792e+03,-5.0000e+01,-4.2499e+00'}
EnSight currently has an arcane bug for using EnSight's traditional query over time by node id or element id when using SOS and when the geometry is changing connectivity and the selected node or element id moves around between servers. This tool avoids this problem, because it does not use a traditional query over time, but rather uses a query/probe at each timestep and walks through time (which works correctly in this kind of a SOS situation).