Reports#
Now that we have learned about the data that Ansys Dynamic Reporting can store and retrieve, let's explore assembling data Items into the Ansys Dynamic Reporting report.
A report is a visual layout of your processed data. Each report is a collection of templates, where each template processes a subset of the data and specifies how the data is going to be filtered, displayed, aggregated, and analyzed. For example, you might have a template that queries the Ansys Dynamic Reporting database, retrieves numerical data from a particular dataset, and displays it as a table with labeled rows and columns. Reports are commonly composed of multiple templates, so that a single report will contain multiple sets of data filtered and displayed in different ways.
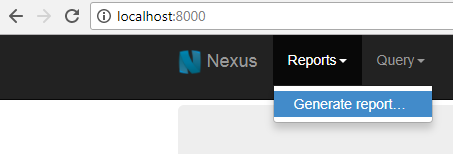
From your web browser, go into Report>Generate Report as shown below.
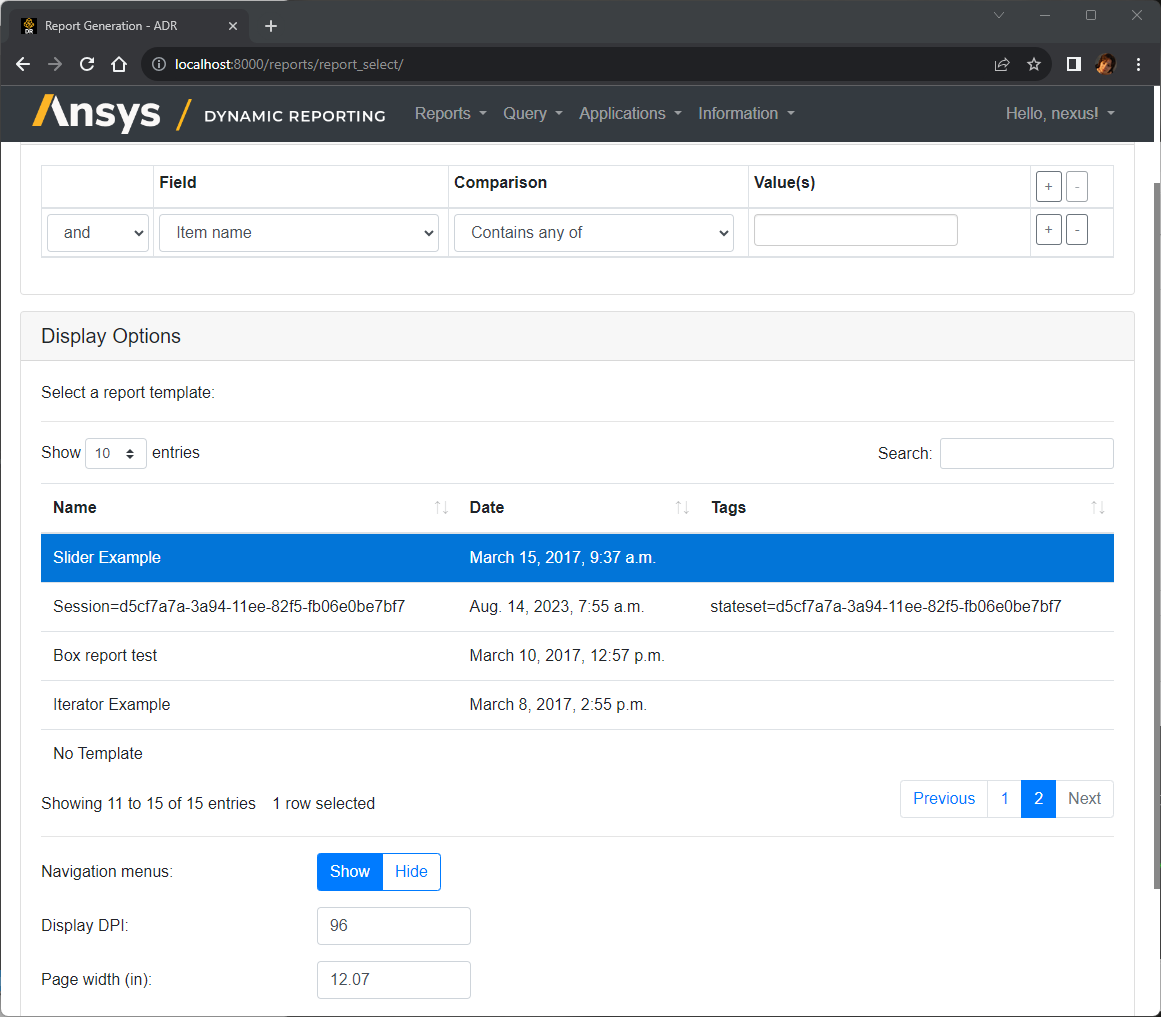
Under Display Options, choose the Slider Example template from the list as shown below. Now, click on Generate report.
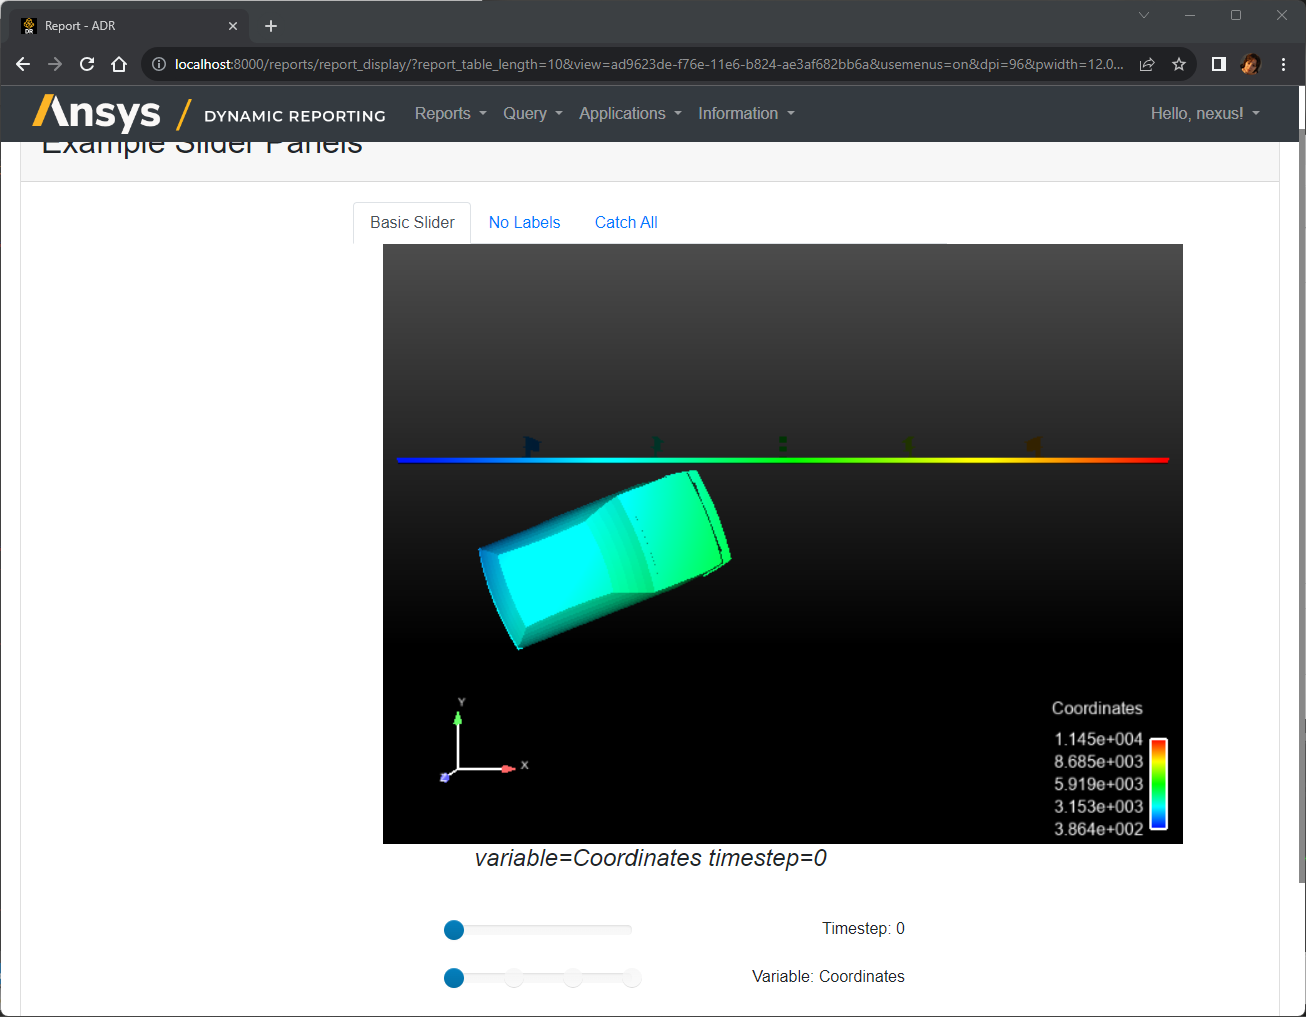
The result of this report is shown below. Notice that the report is designed to demonstrate a template item called a slider, which allows the user to slide sequentially through items based on their tags. See the sliders below to see how this form of web report can provide quick, easy insight into your model by simply arranging the visualization of a set of images in a smart way. For example, let's say you have a time-varying simulation. Instead of saving a movie, you could instead push an image at each timestep. Then, you can create a slider template that provides a quick way to slide through time using your sequential images. You can repeat the same for other parameters (such as a "color-by" variable) to add multiple slider parameters in the same slider, as in the example below.
Next, let's explore a demonstration template whose purpose is to show every entity that it finds, in no particular order. This is handy to get a visual overview of all of your items. So, choose Reports>Generate report again.
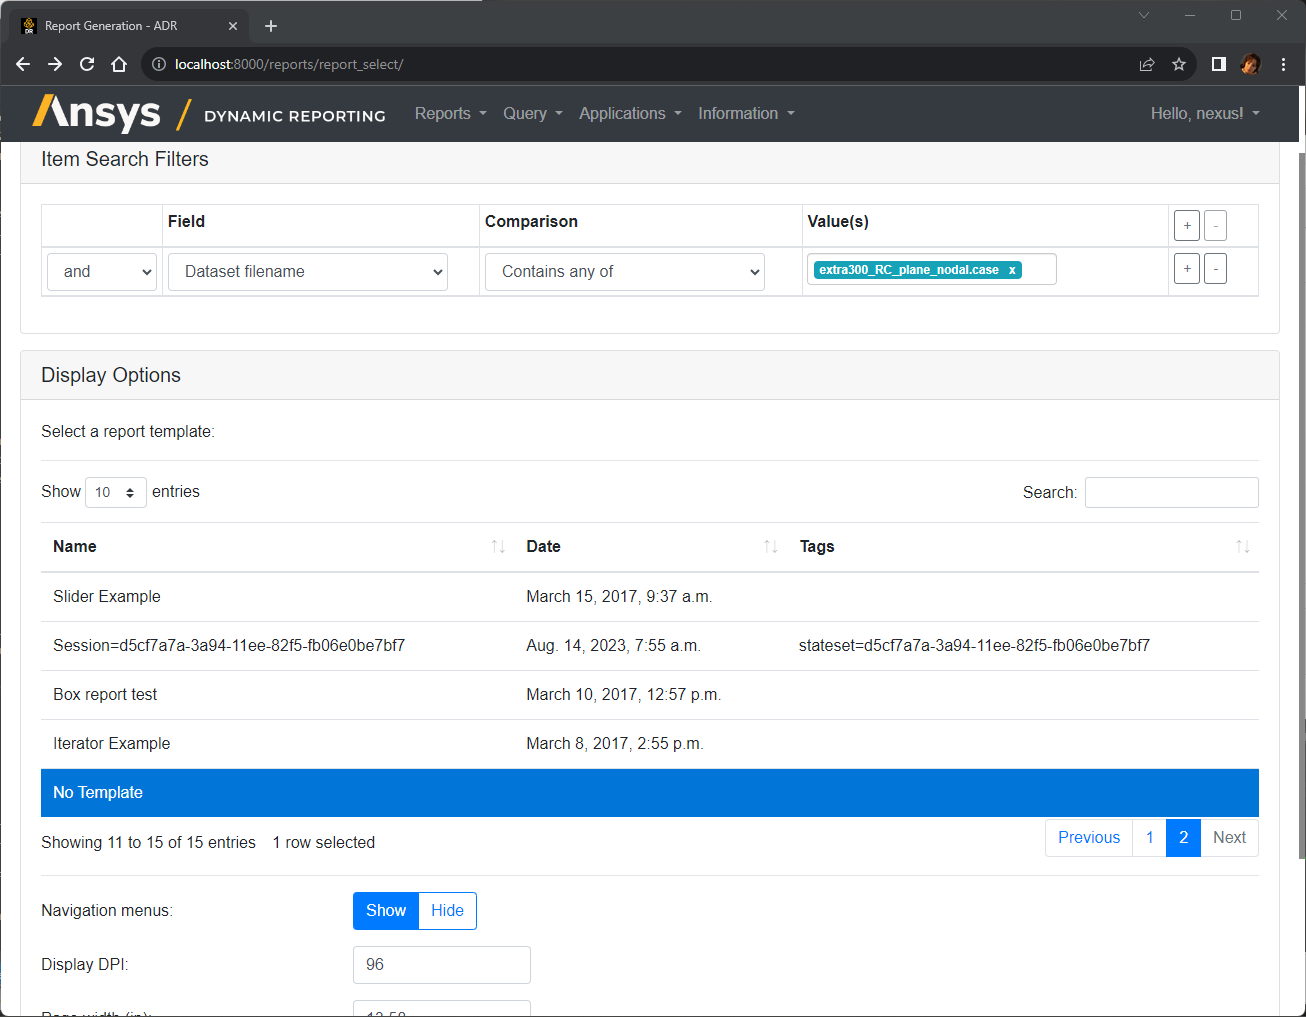
Choose the "No Template" report template. By default, this shows all the data items contained in the database. Let's filter the data by a dataset as shown below (set in the filter the Dataset filename to contain extra300_RC_plane_nodal.case). Click Generate Report.
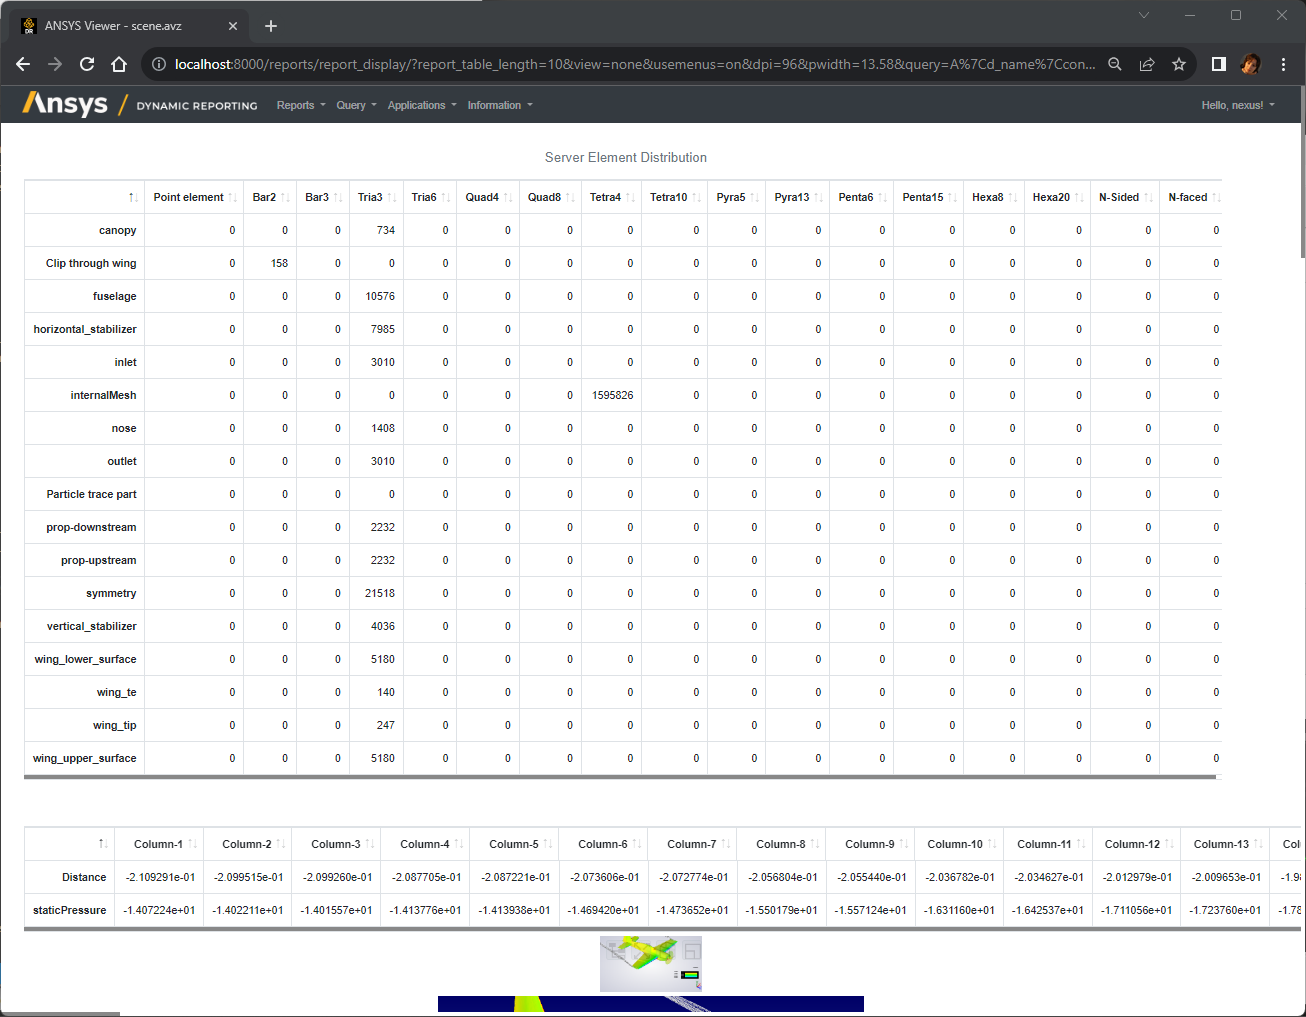
Now, only the Report Items that belong to the Database with data file called "extra300_RC_plane_nodal.case" are visualized. The top result of the report generation is a table containing the number of elements per type per part, followed by a query report item of the static pressure vs. distance on the wing. Scroll down to see a 3D geometry item and keep scrolling to see two images, more tables, and other entities of interest.
Now let's use the No Template report template to display our three gmv Report Items. Go into Reports>Generate report…
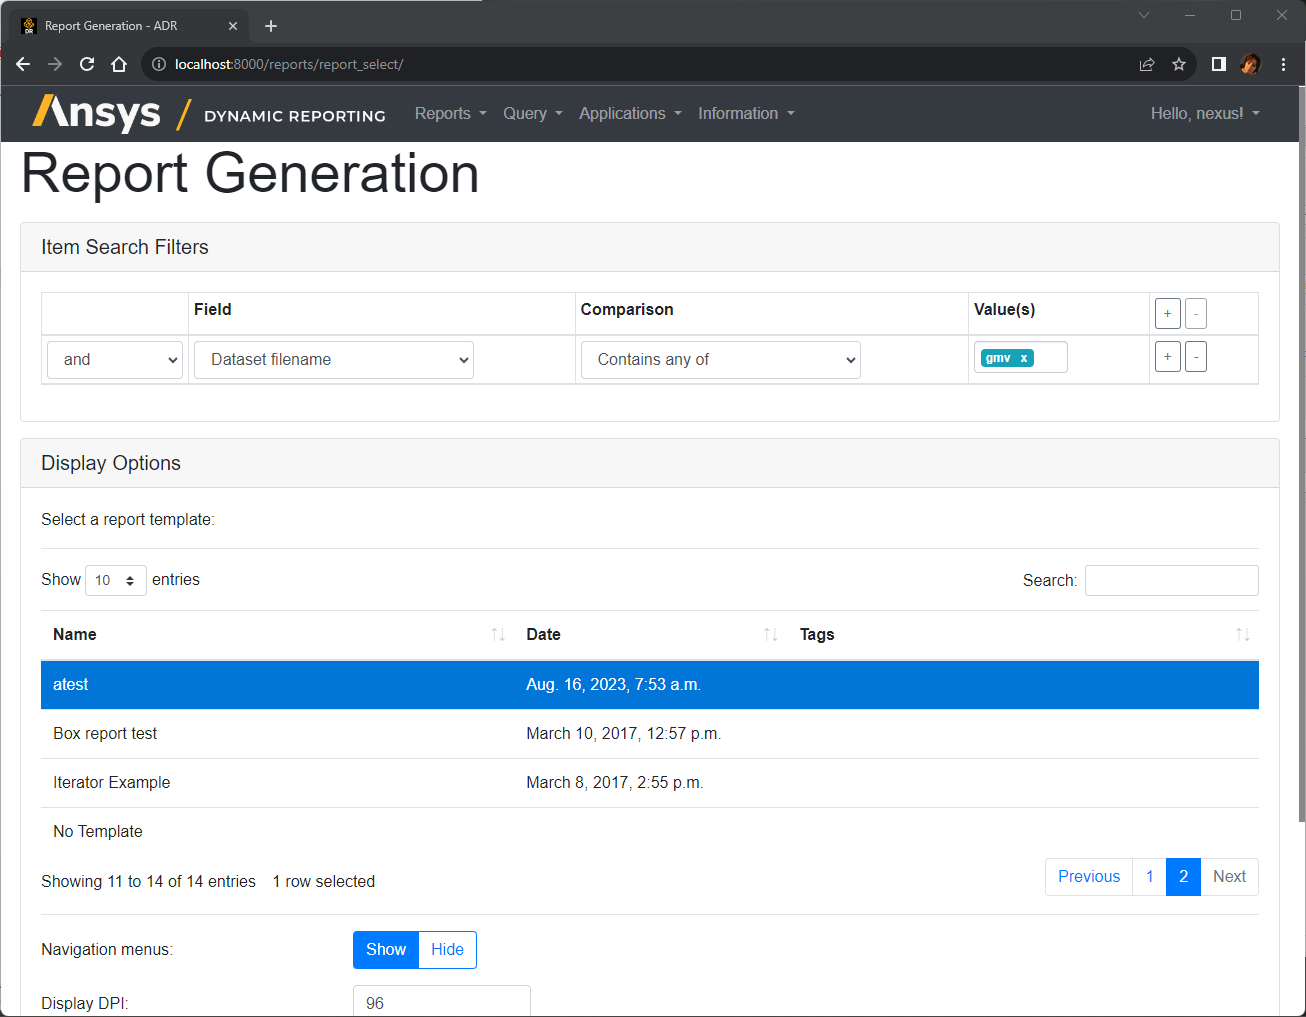
Once again choose No Template, but this time let's filter by dataset filename gmv. Then, click on Generate Report.
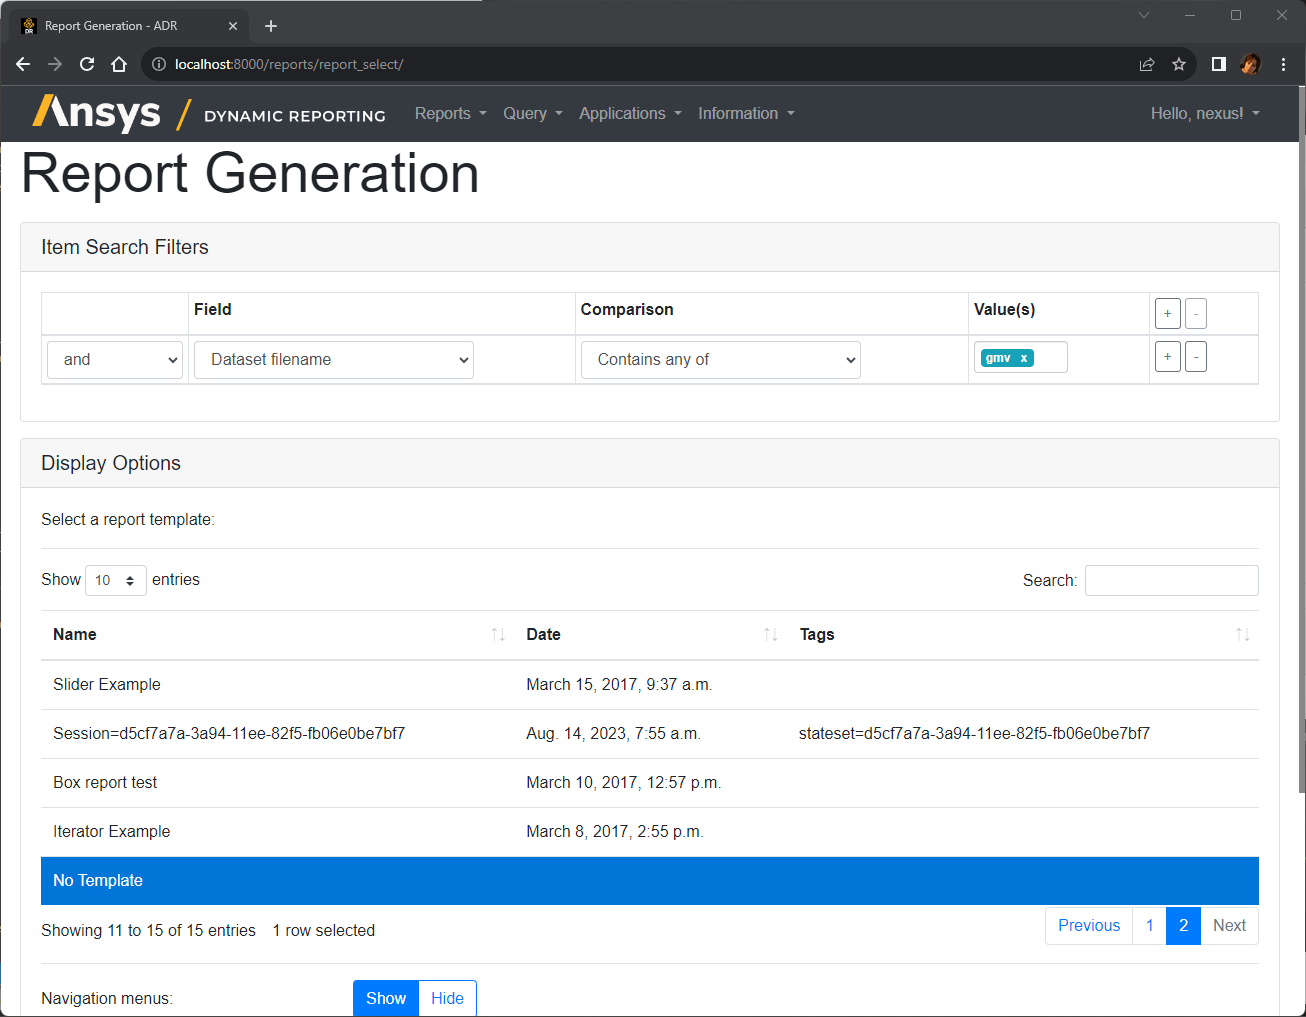
This time, only the Report Items that we have added recently (from the EnSight interactive session and by manual upload) are visualized in the Report.
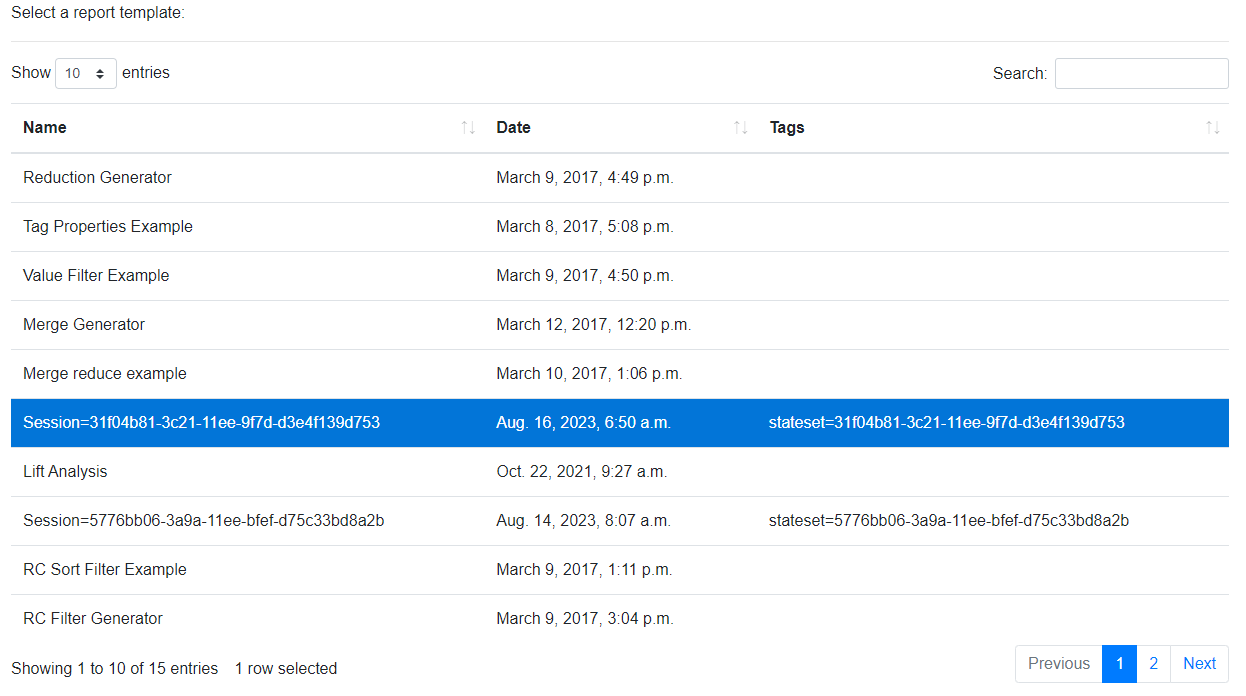
Note that there is also a Report template called "Session=31f04b81-3c21-11ee-9f7d-d3e4f139d753. This is a report automatically generated from the EnSight session with that guid. Note that your guid will look different - every interactive session of EnSight generates a random guid, to avoid overwriting data. Go into the Reports tab of the web interface and select this report template:
Generate the report by clicking on the Generate Report button. You will see it is a report with only the two items that were created by the interactive session of EnSight: the image and the 3D scene. Moreover, you can see that both these items appear in sections called "Interactive (*)". This is because this template is actually used to create a complete report divided in chapters using the States mechanism of EnSight. For more information about that, see the EnSight manual.
So we have seen how to find and use existing templates to generate reports from filtered data. If you have multiple datasets, then you can use a filter that selects only one of them at a time, and run the template to get a report for each dataset separately. But how do we create and edit a template to use to generate or edit a report?
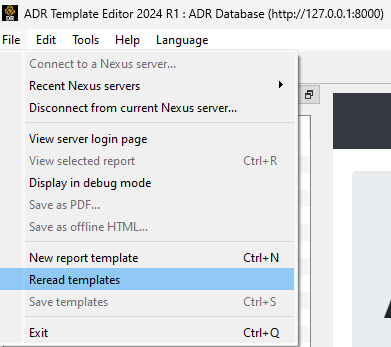
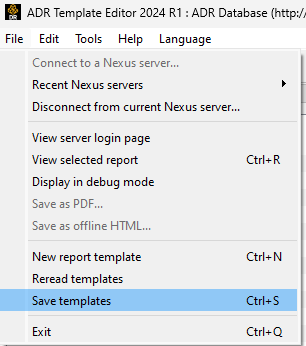
Go back to the Ansys Dynamic Reporting Template Editor application. The first step is to update it so it reflects the new status of the reports. Go into File -> Reread templates:
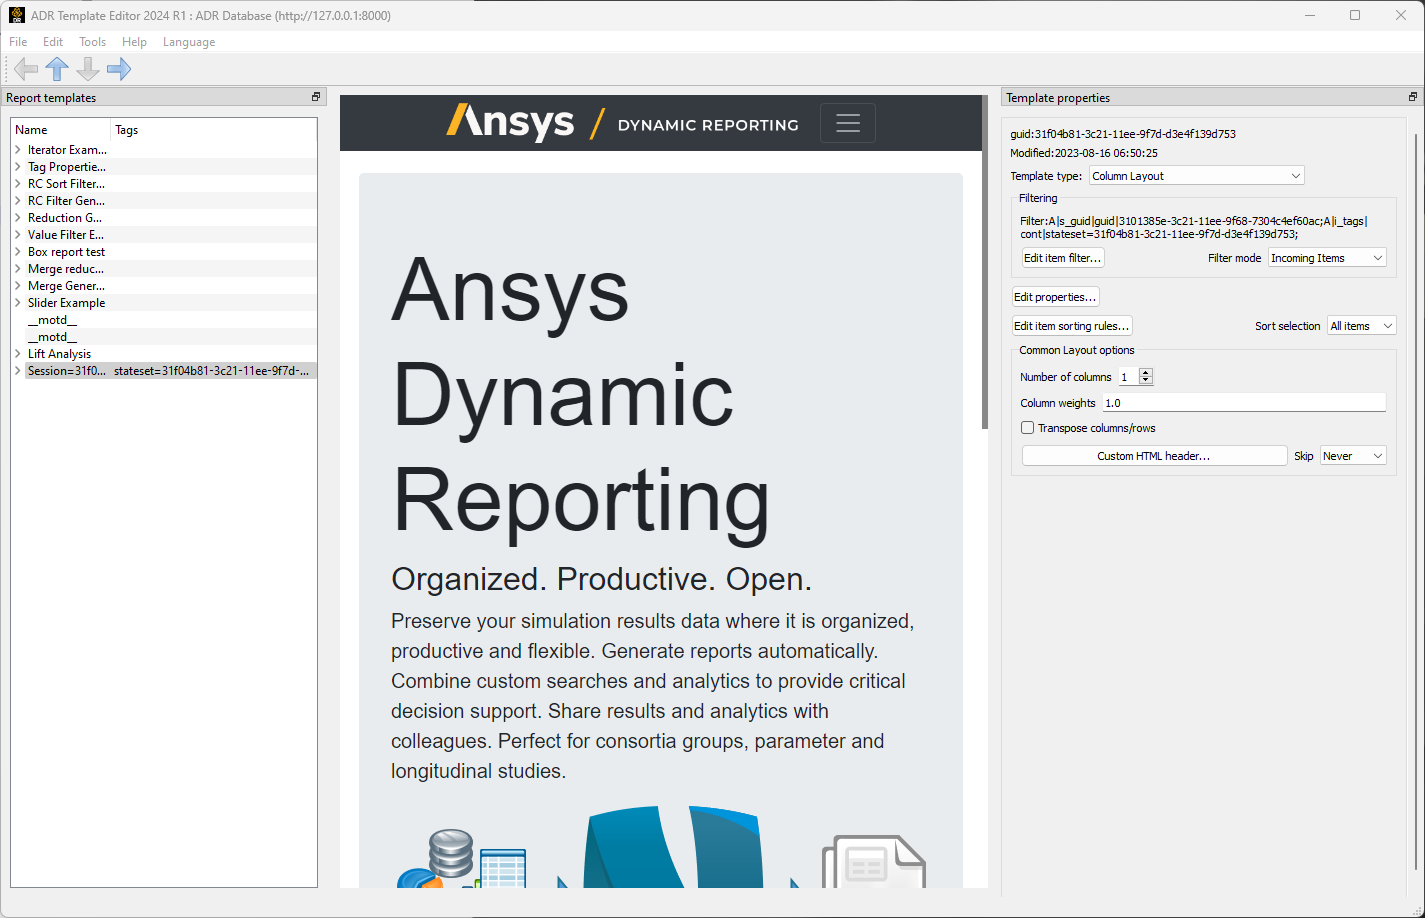
The updated report templates will appear. Rather than editing one of the existing ones, let's instead add a new one.
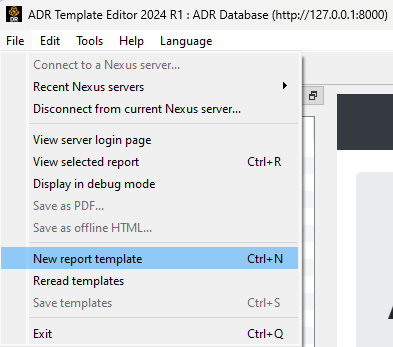
To create a new, top-level template, go into File>New report template
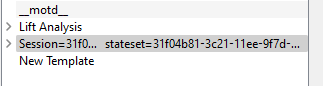
Your new report will show up in the list as New Template. This is at the top level and is not indented. It is a "parent" template.
Double click on the New Template and change its name it to "atest".
You have now created a new report template. When you generate a report using this template, all the data contained in the database that matched the filter search (that is done in the web interface) will be shown.
Templates are nested. To edit a report template, you create new templates that are children of your parent template. Each child will inherit the data items from its parent. It will be able to apply its own set of filters and set its own visualization rules. Let's see how this works in practice.
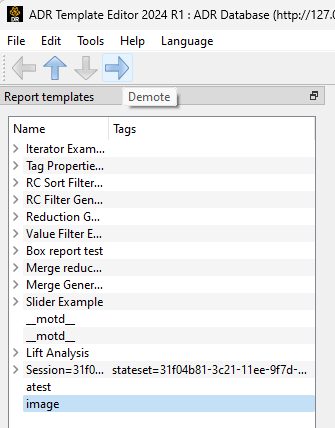
Create another template and call it image. To create it, go into File -> New report template.
Double click on the item that appears in the Report templates list and rename it "image". Then, make sure it's selected and click on the right arrow to demote it under atest.
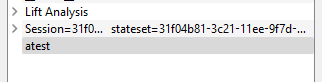
Now you will see image as a child of atest.
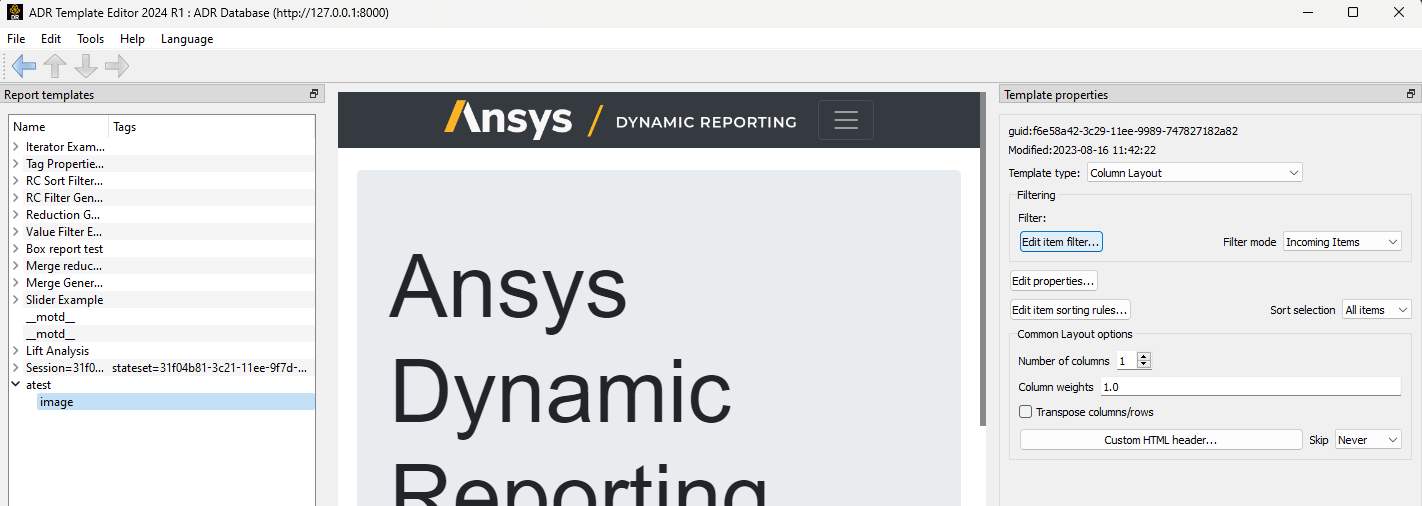
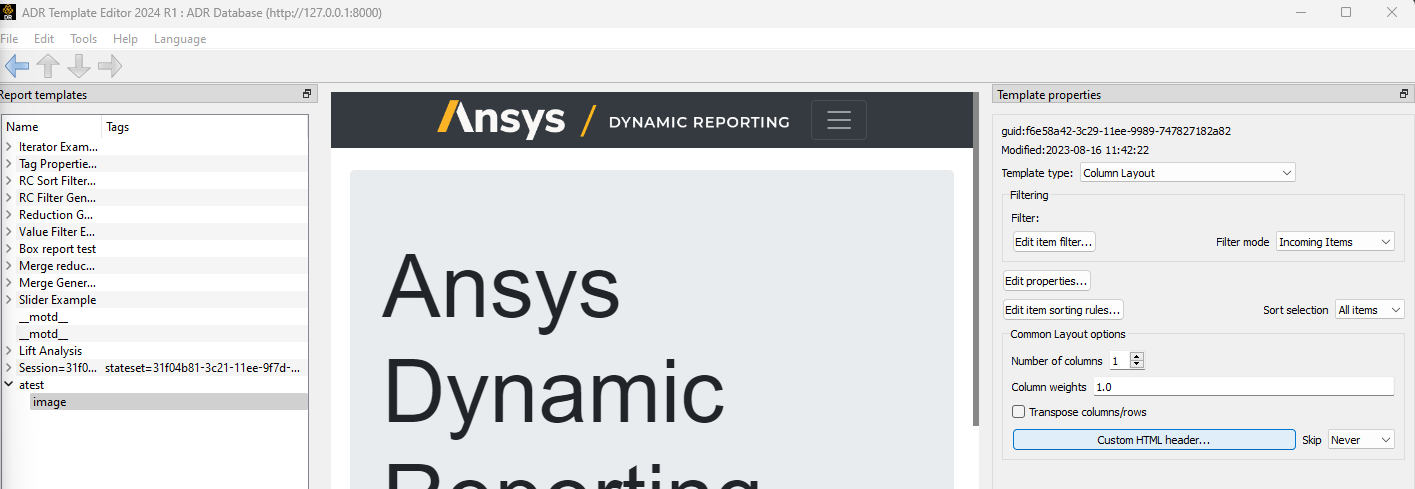
Select the image template and notice that there are a number of entities in the right panel you can change. Click on Edit item filter...
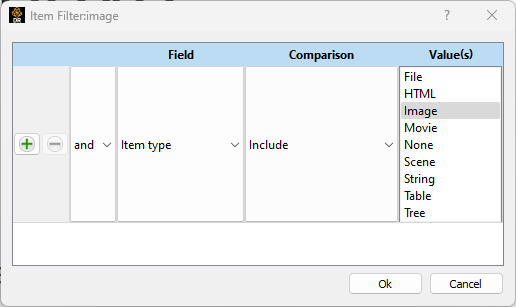
Enter the filter for item type to be an Image, as shown below. Then, click OK.
Next, let's create a short title and description for this template. Click on the custom HTML header button.
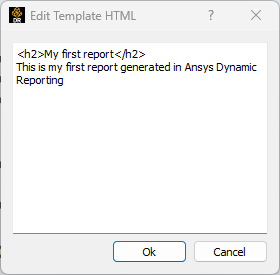
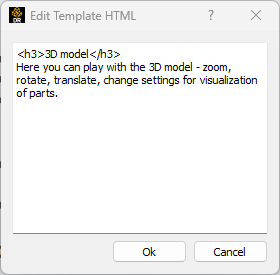
Add in some HTML that will show up as the header text for the image.
Now we have a report template with a filter that will grab all image items passed by the atest parent template and display them with a header in HTML above it.
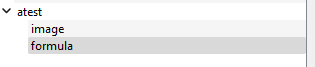
Let's add another template, name it "formula" and demote it to being a child of atest, a peer to "image". Recall, as above, File>New Report Template to generate the template, double-click to rename it, click on the downward arrow as necessary to move it below "image", and the right arrow to demote it under "atest". Do not demote it too far and make it a child of "image" (and a grandchild of "atest"). Rather, it should be demoted only to the same level as "image", as shown below.
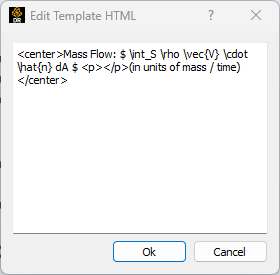
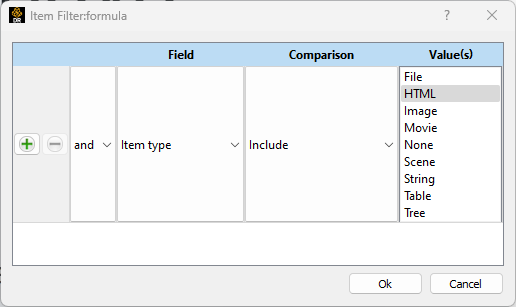
Make sure that the "formula" template is selected in the template list, then click on Edit item filter, and in the dialog below that pops up, edit it as shown to filter for HTML item types. Click OK. Edit its HTML header to contain a Latex forumla for the Mass Flow:
Now we have atest with its first child showing image item and the second child showing HTML items.
Let's add in a 3D geometry template filter to add in the report the 3D scene of the simulation. Create a new template, name it "3Dscene", and demote it to being a child of atest, rendered below formula. (Recall, as above, File>New Report Template, double-click on it to change its name, click on the downward arrow as necessary to move it below formula, and the right arrow to demote it under atest. Don't demote it too far and make it a child of formula (and a grandchild of atest). Rather it should be demoted only to the same level as image as shown below.) With 3Dscene selected, click on Edit item filter.
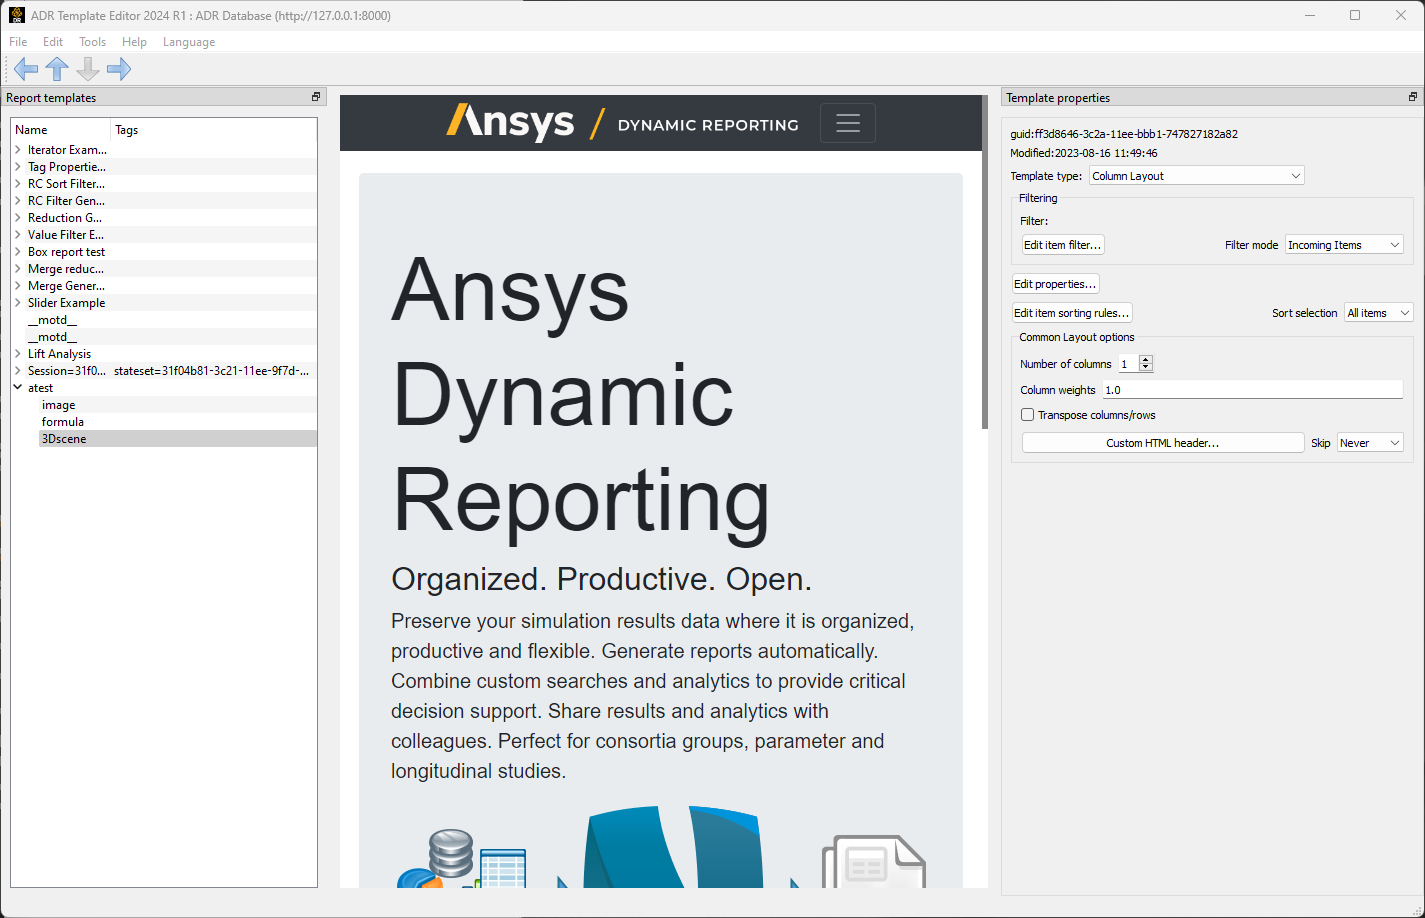
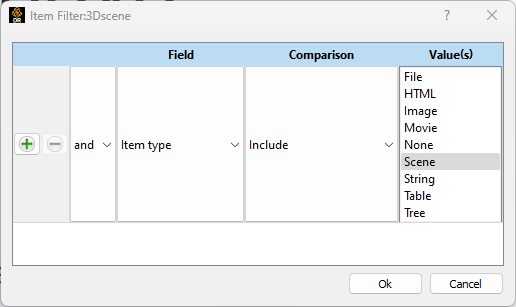
Put the following filter in this template to extract out Scenes (3D geometry) then click OK.
With 3Dscene selected, click on Custom HTML header, and add the following text, which will appear just above your 3D scene:
Now it's time to save the template that you have created into your local Ansys Dynamic Reporting database! This will cause the report template to show up in our local Ansys Dynamic Reporting database.
Go to your web browser and look in the Report section. You may need to reload the page if you have it already opened from before. Notice that now "atest" appears in the list of templates. Select it and set your filter to use dataset filename of gmv. Why do we do that? Because our current template is set to select all images, all HTML, and all 3D scenes. We want to pre-filter here to just report items from our gmv dataset. Run the report by clicking on Generate Report. The power of this template method is that you can run several EnSight sessions on abc1, abc2, and abc3 datasets, and save the same three report items (image, HTML, and 3d scene) from each of the datasets using a corresponding dataset filename (abc1, abc2, or abc3), and create this same report on each one separately, changing only the filter to abc1, abc2, or abc3.
In other words, you need to create only one Report template, and it will be applied on any dataset you set in the top filtering field. You do not need to create a separate Report template for each dataset. This saves an enormous amount of time when working with large numbers of datasets and will make your reports homogeneous across datasets.
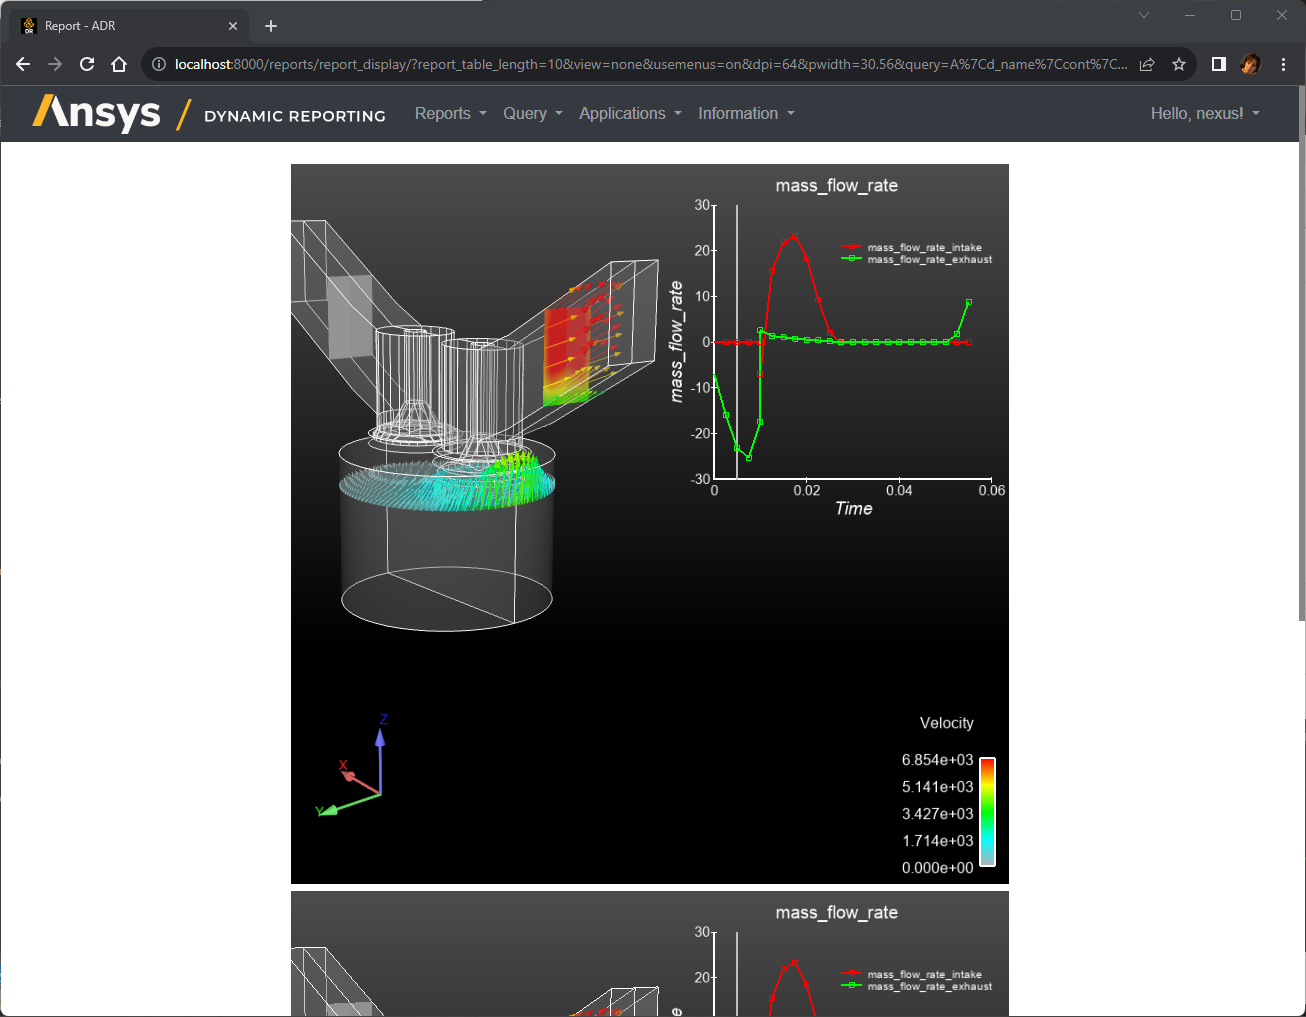
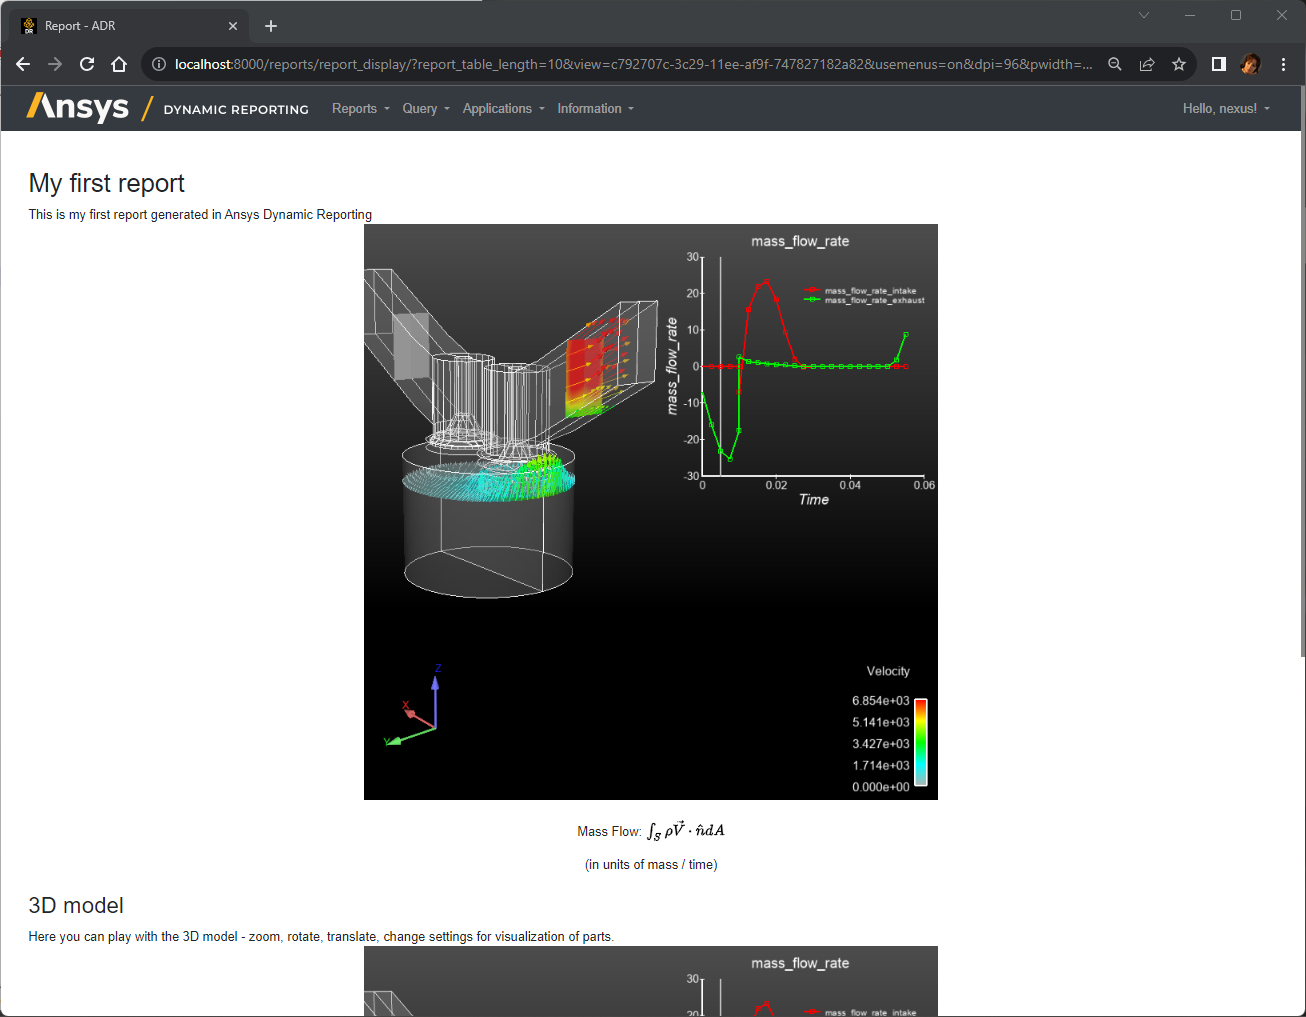
And here is our report using only report items with dataset filename = gmv. Notice the custom header above the image and 3D scene from our HTML header that we edited in the report template and the forumla section shows only the HTML that we set with the Latex formula of Mass Flow.
In this section, we walked through generating a very simple Report. More complex reports can be created that take advantage of the Ansys Dynamic Reporting template editor capabilities. If you would like to see some of what can be achieved, please go to the ADR demo website.
This is an ADR Nexus web server, accessible to everyone, with example Report Items and Reports. Go into the Report section and run some of these professionally done, full reports. This will give you an idea of the power of Ansys Dynamic Reporting.