Generator: Table Merge#
The purpose of the table merge generator is to take multiple input data table items and combine them into a single table. The merging process can be customized to select specific rows to merge. The operation has a number of options that make it possible to fold data from multiple data items into individual rows.Unlike many other generators, the merge generator produces a single output table data item every time it is passed a list of input data items. If there are no table data items in the input list, no output table is generated.
Configuration options#
The configuration options for this generator are relatively complex. A summary of the configured merge operation is presented in the template editor main window. An example might be:
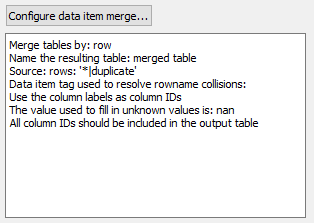
Clicking on the 'Configure data item merge...' button brings up the editor for these settings.
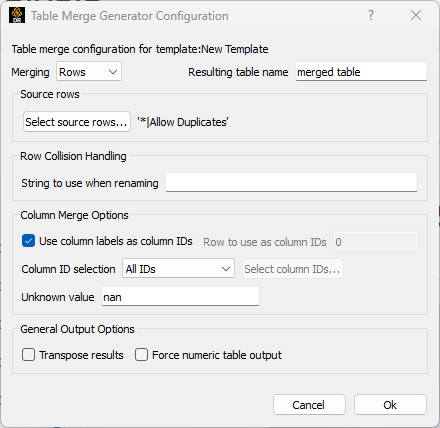
The merge process can be performed by row or column. The 'Merging' configuration selects which operation to perform. If 'Rows' merging is selected, the selection of portions of each input table is performed row by row. If 'Columns', the operation is performed column by column. Thus a Column merge is just a row merge applied to the transpose of the input table, followed by a final transpose before output. For the remainder of this discussion we will focus on the 'Rows' merge nomenclature, but the operation can always be performed as a 'Columns' merge operation using the 'Merging' option menu.
There is an option to set the name for the generated table(s). The table name can include macro expansions and will use the current data item to access additional macro sources (e.g. tag values). The generated tables will include a generate_item_count=N tag that is the number of input table data items used to build the output table.
The default configuration is to simply concatenate all of the rows from all of the input tables into the output table. The resulting table will have the same number of rows as the sum of the numbers of rows in all of the input tables. The output columns will be the set of unique columns from the list of all of the columns in all of the input tables. When a row is selected for inclusion in the output (depending on the Source Rows settings), the generator walks all of the columns in the selected row. The column itself may be selected or not depending on the Column Merge Options settings. If the column name already exists in the output table, the associated value in the selected row will be placed in that column in the output. If the column name does not already exist, a new column is added to the output table. The undefined cells in the table will be filled with the 'Unknown Value' selection.
The process begins by selecting input rows using the 'Select source row(s)...' button. The dialog allows the row selection rules to be defined. These rules are applied in order to each input table data item. The order of the rules implicitly selects the order of the output columns. The dialog itself looks like this:
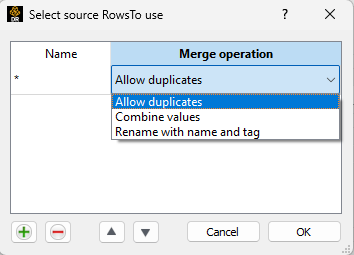
The Name column selects the name of the row(s) to be selected. The name can be the row index (a number), the row label name or a row label name that contains a glob style wildcard. A specific merge operation is specified with each row selection. When a row is selected for merging with the same name as an existing row, the 'Allow Duplications' option will simply add the new row and the output table will contain rows with identical row label names. Alternatively, the generator can combine the values of the new row with the row that already exists in the table when the 'Combine Values' option is selected. The final value will be the last row merged into the output table. The 'Rename with name and tag' option will cause the new row to be renamed and then added to the output table. The final row name can be just the original row name (default) or a new string created starting from tag names and/or values. The final row name is specificed in the 'Row Collision Handling' portion of the dialog. Place any string there, and add the name of the tag to use in between {{ }}. The '*' syntax can be used to refer to tags when there is no tag value associated with a tag key. In addition to tags present on the source tables, the following tags can be used as well:
Tag |
Value |
|---|---|
_index_ |
index number of the input table that produced the row (0 based) |
_guid_ |
GUID of the input table item |
_name_ |
name field of the input table item |
_source_ |
source field of the input table item |
_rowname_ |
original name of the row |
So for example if two rows come from items that have tags:
Item 1: dp=dp0 SimulationA
Item 2: dp=dp1 SimulationB
the following value in the 'Row Collision Handling' field:
New name is {{dp}} for {{Simulation*}}
will result in merged rows named:
New name is dp0 for SimulationA
New name is dp1 for SimulationB
With the row selection and merging options set, the options for selecting and merging columns needs to be set in the 'Column Merge Options' section. Column matching is done using 'Column IDs'. The 'Use column labels as column IDs' checkbox selects that input table column labels should be used as column IDs. If unchecked, the values in any row can be used as the column IDs. The row in the input table to use in this case can be entered as the row number or as the row label name. If the input table has no column labels and the option to use column labels as column IDs is checked, the column names will be the index of the column.
Once the column IDs have been established, the 'Column ID selection' option menu is used to control what columns IDs to be merged. The default 'All IDs' option will select all of the columns. The 'Only Common IDs' option will select only those column IDs that are in common over all of the input table data items. The 'Select Specific IDs' option will allow the 'Select column IDs...' button to select a collection of specific column IDs to be included in the output.
As noted previously, the 'Unknown value' is used to fill in empty table cells that might be introduced by merging rows from two tables that do not have common columns. The 'nan' value will be mapped to floating point NaN in numeric tables. This can be useful when merging data for plots that do not have the same 'X' axis values as NaN values are skipped when selected for plotting.
At the bottom of the dialog are two general options. The 'Transpose results' checkbox specifies that the final table should be transposed before being placed in the output stream. The second option causes the output table to be output as a table of numbers. The merge operation preserves the cell type of the input tables where possible. If any string tables are encountered, the output will be a string table.
The settings illustrated above were used to concatenate three input tables (one for each month) into the single table used in the Table Reduction generator example by simple concatenation of all of the rows and columns of the input tables. The columns in the input tables were identical.
Example#
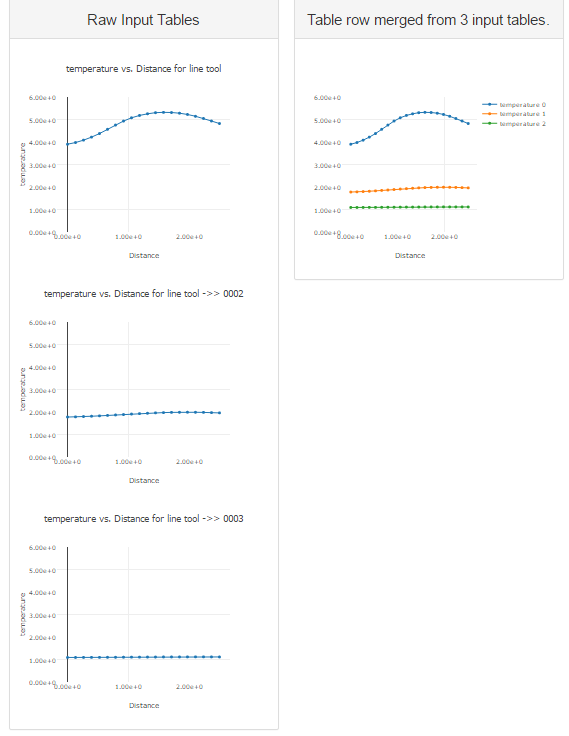
A more complex, but common example is illustrated next. In this example, a collection of tables that represent template vs distance plots at three locations in a dataset. We would like to put these three traces on a single plot. This is done by exploiting many of the core features of the table merge generator. The template layout used looks like this:
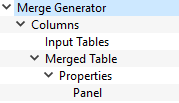
'Merge Generator' selects the three input tables to use. 'Columns' is a simple two column layout so that the inputs and output can be displayed side by side. The 'Input Tables' is a simple Panel layout that will be used to display the three input tables as plots. The 'Merged Table' template is an instance of the Table Merge generator. It is configured as shown/discussed below. The 'Properties' layout is an instance of the Tag Properties layout that makes the tags on the generated table available as properties for table layout/display. 'Panel' is a simple panel layout with Custom HTML header... set to:
<h2>Table row merged from {{generator_item_count|floatformat}} input tables.</h2>**
The generator layout adds a tag 'generator_item_count=N' all of the tables it outputs. This is the number of table data items used as the input to this output table. The Tag Properties layout made it available for use in the HTML header.
The generator configuration specifics look like this:
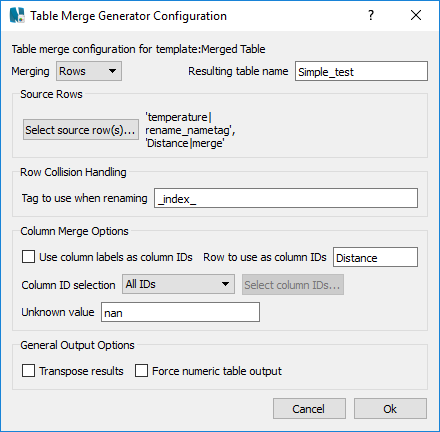
Two sources are selected. All rows with the name 'temperature' are to be merged and they should be renamed by adding the value of the tag to the input row name. In this case the tag will be '_index_'. All the rows with the name 'Distance' will also be included and they should be merged into a single row. Assuming each input table has a single 'temperature' and a single 'Distance' row, the output will include 3 'temperature+_index_' named rows and a single Distance row. In the column options, the 'Distance' row has been selected to be used as the column IDs, so the final Distance row will have all of the unique values in all three Distance input rows. The implication here is that there will be empty cells in the output table then the Distance values are not in common between the source tables. In this case, that is ideal as it preserves the desired X vs Y plots and allows for a common X axis named Distance to be used for all of the Y rows.
When run, the reports looks like this: