Generator: Table Reduction#
The table reduction generator can be used to collapse a number of rows or columns into a single row/column. In this process, the values can be combined using common operations like: count, sum, minimum or maximum. In the simplest use-case, the system can generate a 'Total' row from a collection of rows. This operation is applied to each input table data item and a new output table data item is produced for each input table.
Configuration options#
The configuration options for this generator are relatively complex. A summary of the configured reduction operation is presented in the template editor main window. An example might be:
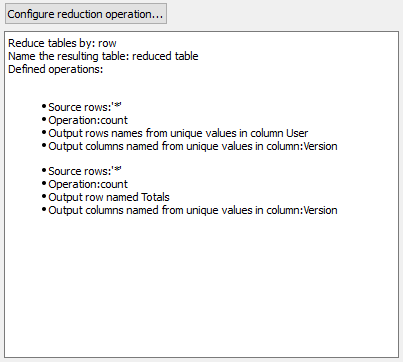
Clicking on the 'Configure reduction operation...' button brings up the editor for these settings. The entire process can be performed by reducing the rows or columns. The 'Reduce' configuration selects which operation to perform. Conceptually, Column reduction is just row reduction applied to the transpose of the input table, followed by a final transpose before output. For the remainder of this discussion we will focus on the 'Rows' reduction nomenclature, but the operation can always be performed as a 'Columns' reduction operation using the 'Reduce' option menu.
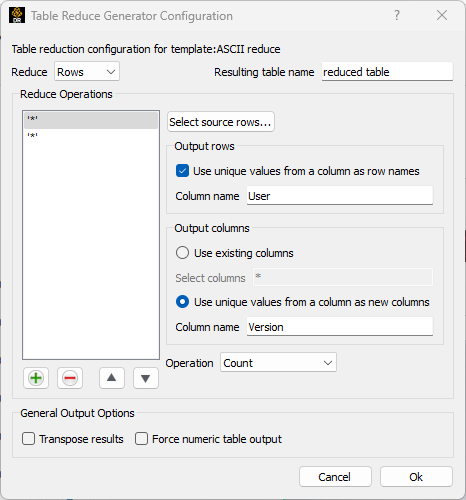
There is an option to set the name for the generated table(s). The table name can include macro expansions and will use the current data item to access additional macro sources (e.g. tag values).
In the 'Reduce Operations' section, the user may set up one or more
reduction operations. The  button add an additional reduction
operation while the
button add an additional reduction
operation while the  button removes the currently selected
operation. The triangle buttons serve to select the order that the
operations will be performed in. This ordering selects the order of the
output rows as the output table rows are populated sequentially by each
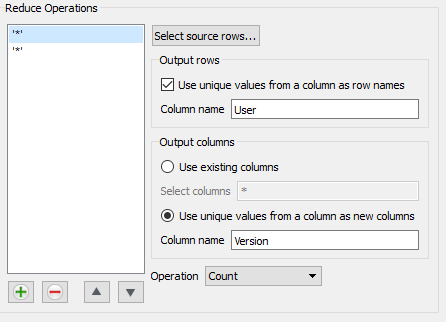
operation. In the example, we have two reduction operations set up. The
first one is selected. To the right of the operations list are the
options for each reduction operation. The 'Select source rows...' button
selects which input rows should be used as the source for the reduction
operation. The expression for the source rows can include row indices,
row label names or row label names with 'glob'
wildcards.
Both operations defined above use all of the rows as sources '*'.
button removes the currently selected
operation. The triangle buttons serve to select the order that the
operations will be performed in. This ordering selects the order of the
output rows as the output table rows are populated sequentially by each
operation. In the example, we have two reduction operations set up. The
first one is selected. To the right of the operations list are the
options for each reduction operation. The 'Select source rows...' button
selects which input rows should be used as the source for the reduction
operation. The expression for the source rows can include row indices,
row label names or row label names with 'glob'
wildcards.
Both operations defined above use all of the rows as sources '*'.
When performing a reduction operation the output can be a single row or a collection of rows. This is controlled by the 'Use unique values from a column as row names'. If that checkbox is unchecked, the output row label name is specified explicitly in the edit field. In the example, the second operation will produce a single row with the row label name 'Totals'.
If the box is checked, the output row label name will be determined by the unique values found in a specific column. The first operation in the example is configured to use this option. In this case, the edit field will ask for a column name. The reduction operation works a bit differently in this mode. First, all of the unique values in the specified ('User') column will be collected. The input rows will be separated into separate groups based on what unique value they have for that column. At that point each group of input rows will have the specified reduction operation applied to them, independently, producing one output row for each group. The output row labels are the unique value from the specified column. In the example, all of the rows where the 'User' name is 'jill' will be collected into one group, the reduction operation performed and a row named 'jill' is produced.
Thusfar, the rows in the output table have been specified, but the columns have not. The output columns may also be specified. Two options exist: 'Use existing columns' or 'Use unique values from a column as new columns' and can be selected by radio buttons. Note that the reduction operation will be applied separately for each output column.
'Use existing columns' simply copies the column structure from the input table to the output table. There is a field that allows the column label names to be selected using a glob style wildcard expression. If the input table has no column labels, the index number of the column becomes the column label for this selection process. The default is to include all of the input columns '*'.
The 'Use unique values from a column as new columns' will potentially create multiple output columns using the unique values in an existing column for all of the selected rows. For example if the 'Version' column (as selected above) includes the values 1.0, 1.1, 1.3 and 2.0 (in the rows selected by the reduction operation), the output table will have columns with the labels '1.0', '1.1', '1.3', and '2.0'. In this case, the selected input rows are separated into 4 separate groups based on those values. The reduction operation for the output column will only include input values from the rows in the associated groups.
The output column specification can be different for each redution operation. This is handled by first collecting all of the output columns generated by each of the reduction operations. If two operations create the same column labels, that label is only added once into the output table. The order of the columns (like the rows) depends on the ordering of the reduction operations as they are added left to right.
The options have now specified an output row and output column for every input cell. The generator collects all of the values for that target and performs the operation selected by the 'Operation' option menu. The example computes the number of input values for the operation (count), but many other operations are supported. Note that NaN values are not used when computing these values.
Operation |
Result |
|---|---|
Minimum |
The minimum of all of the values is returned. |
Maximum |
The maximum of all of the values is returned. |
Count |
The number of values is returned. |
Sum |
The result of adding all of the values together is returned. |
Difference |
The difference between the values is returned. Note: the difference is taken in order of the rows so generally it is the first value minus all of the other values. This option may only make sense when two rows are being collapsed together. |
Mean |
The average of all of the values is returned. |
Standard deviation |
The standard deviation of all of the values is returned. |
Skewness |
The skewness of all of the values is returned. |
Kurtosis |
The kurtosis of all of the values is returned. |
At the bottom of the dialog are two general options. The 'Transpose results' checkbox specifies that the final table should be transposed before being placed in the output stream. The second option causes the output table to be output as a table of numbers. By default, the reduction operation can be performed on a table containing strings, only interpreting the necessary cells as numbers for the operations. The generator tries to preserve the string format in the output table unless the 'Force numeric table otuput' checkbox is checked.
Example#
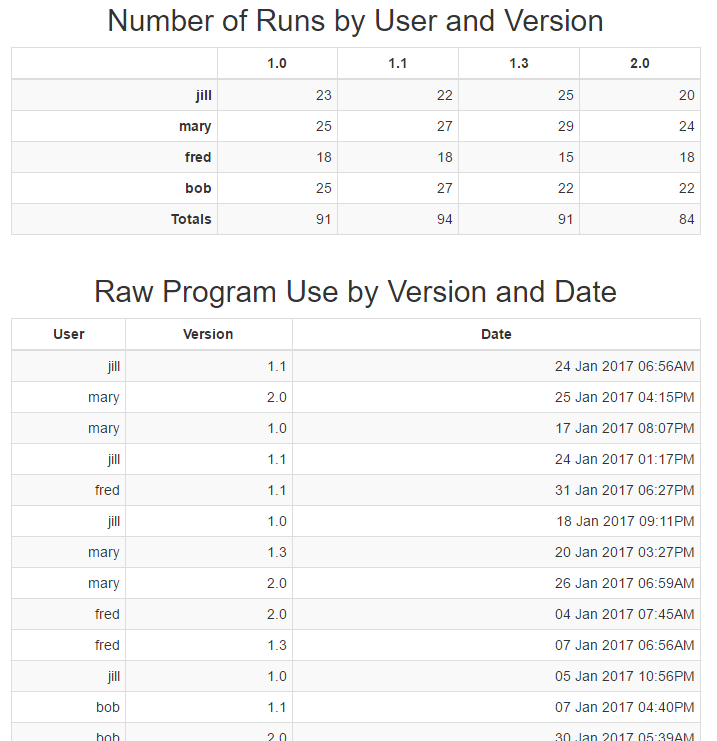
Consider the configuration described in the dialog screenshots above and some input tables that include 'User', 'Version' and 'Date' columns. We will use a report template layout that looks like this:
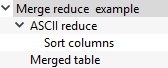
The 'Merge reduce example' template is a Table Merge Generator that is used to select three input tables and concatenate them into a single table. That single, merged table is passed to the 'ASCII reduce' Table Reduction Generator instance, configured with the two reduction operations dicsussed earlier. 'Merged table' is a simple column layout to show the input table. 'Sort columns' is a Table Row/Column Sort Generator used to sort the columns by their label.
The reduction generator creates a new table consisting of rows aggregated by the 'User' names and columns aggregated by the 'Version' values in the input table. Each cell in the output is the number of rows in the input data item with those specific user and version values. Finally, the second reduction operation includes a 'Total' row that collapses all of the user values together into a single row. The final report looks like this: