Including a Slider View In Your Report#
One of the most popular features of the Ansys Dynamic Reporting infrastructure is the slider. This feature allows the user to merge hundreds of images together into a single visualization, where one or more interactive sliders give the capability to interactively switch between images based on the value of one or more tags. This kind of visualization not only allows the user to condense the information into a single view, but also allows for no loss of information and an easier way to handle a large number of files.
But how can I concretely create a slider report in Ansys Dynamic Reporting, you might ask? Luckily, very few steps are involved.
Identify the slider dimensions#
The first step is to identify which variables you want to use to group the images by. These variables will become the dimensions of the slider. For each dimension, you will be able to change the value of the corresponding variable, resulting in a change of the image displayed in the slider.
An example will help us understand this better. Let's say that you create an image of a Y clip of the model, colored by variable Cp. Now you want to sweep this clip across the Y axis, saving an image for each position of the clip along the Y axis. Now, you repeat the same operation, but this time you color the clip by another variable.
You will end up with n times m images, where n is the number of points along the Y axis for which you take a clip, and m is the number of variables you color the clip by.
In this situation, you will be able to create the slider report with two dimensions: dimension 1 is the Y clip position, and dimension 2 is the variable you are coloring the clip by. In the slider report, you will be able to fix either dimension and interactively change the value of the other one to display the corresponding image.
Create the Slider report#
As a last step, you will create a slider report. Open the template editor of Ansys Dynamic Reporting by typing the command:
adr_template_editor
in a command prompt or shell. Connect to the Ansys Dynamic Reporting session where you stored the data and where you want to create the slider template (see section Getting Started->Using the Database->Reports for detailed instructions on how to do this).
Create a new template (File -> New report template), and rename it "My Slider". You can use the "Edit Item filter…" button if you want to filter the dataset so that only the images for this slider are passed to the template. If you don't create such a filter, all data items in the database will go into the template, unless you apply a query before calling the template in the ADR Nexus server web interface. This approach can be useful if you have multiple sets of images you want to apply the slider template on.
Change the Template type from the default "Column Layout" to "Slider Layout". You can see that some proprieties field are different for this template layout. For a complete description of this template type, see the section Layout Slider.
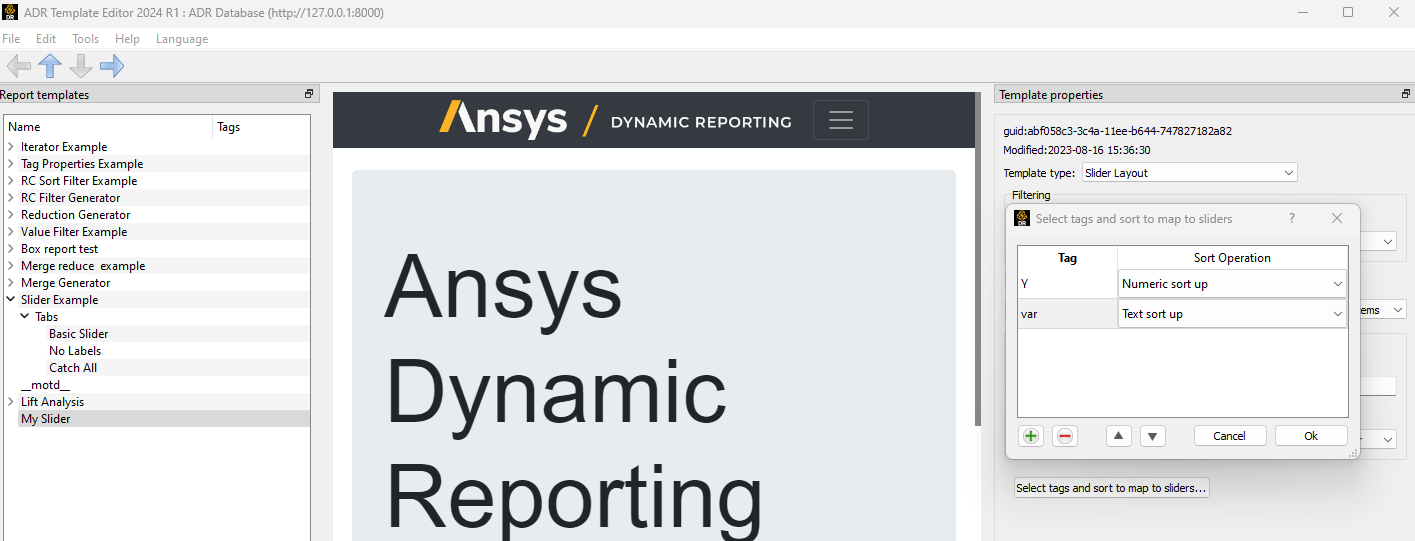
Click on "Select tags and sort to map to sliders…" to set the tags to use for the slider. In the widget that opens, click on "+" to add a tag. In the Tag field, enter the name of the tag. In our example, it would be Y. Since Y is a number, change Sort Operation to be "Numeric sort up" or "Numeric sort down". Click on "+" again and add the second dimension, which is the second tag, var. Since var is a string, you can leave the default Sort Operation "Text sort up".
Add one tag for each of the slider dimensions you want to use. Once you are done, save the template (File -> Save templates).
That is all. Now you can access the My Slider report from the web interface. For more advanced visualization settings and features of this report template, please see the Layout Slider section.