Pushing Data Interactively into the Database#
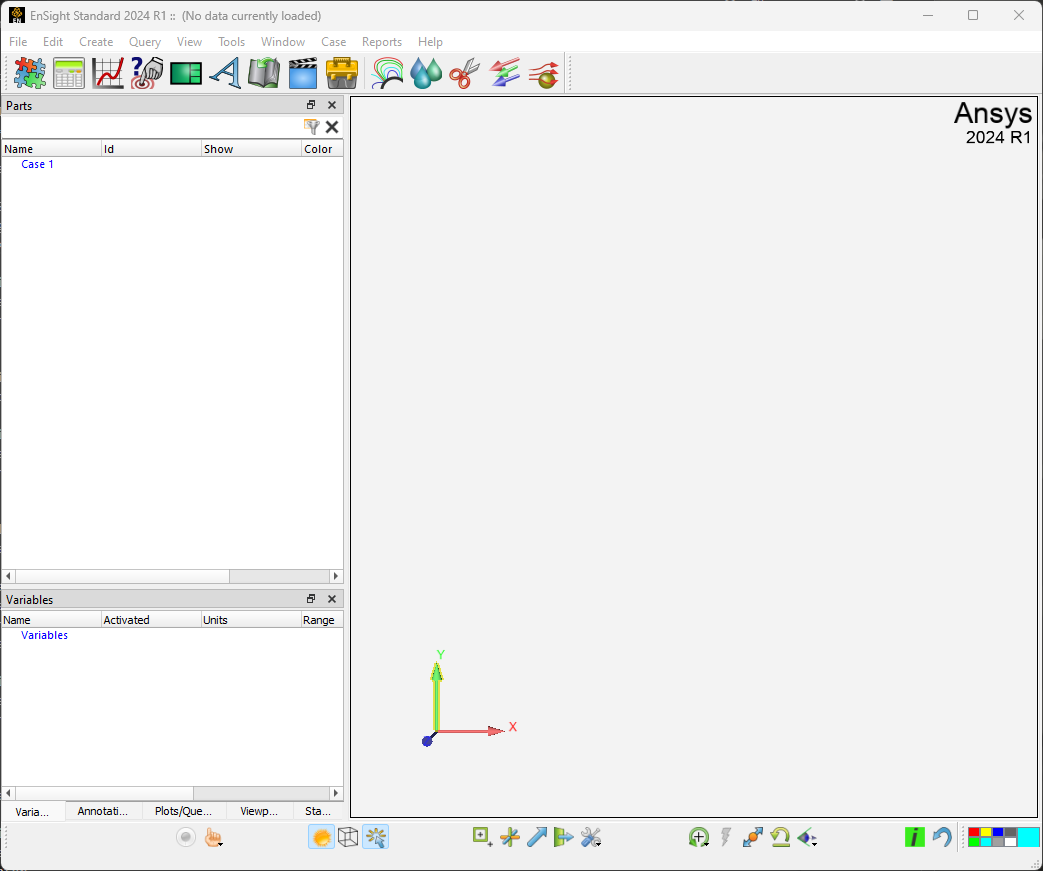
Let's put some data into the Ansys Dynamic Reporting database interactively from EnSight. Launch the EnSight application as you would normally do (Note: this requires EnSight version 10.2.7(a) or newer). In the top EnSight menu, choose Window>Welcome to…
In the resulting dialog that pops up, select Cylinder Flow and click on the Open button.
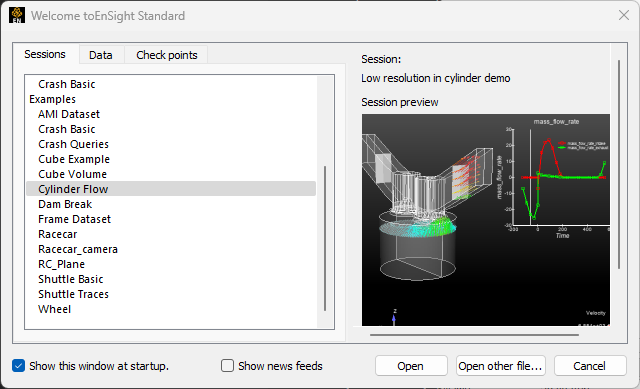
EnSight will load the included Cylinder dataset and will restore the associated session as shown below.
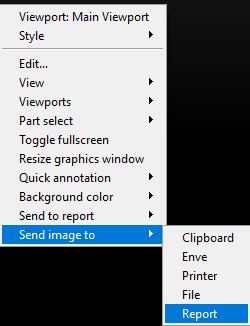
Note that we already have a Nexus server running outside of EnSight. Now we want to push into the attached database an image for the current viewport. Right-click anywhere on the background of the viewport -> Send image to -> Report:
This will pop up a message informing you that EnSight isn't currently connected to any database:
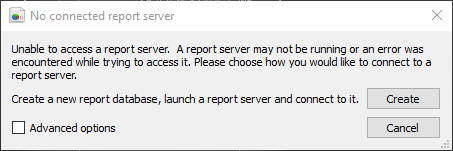
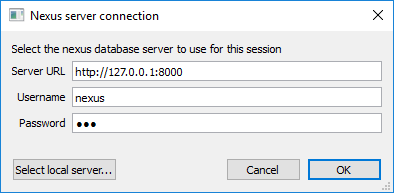
Toggle on the Advanced options, and select the "Connect to a report server that is already running" option. A new widget will pop up asking for the URL, username and password to connect to it. Click on the Select local server, set the port number to 8000 (same as we set in the previous section). Username and password will be filled automatically with the default "nexus" and "cei":
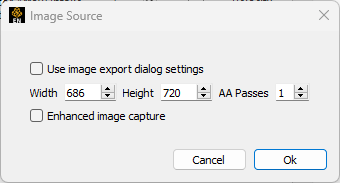
Now you are connected to the ADR Nexus server! A new message will pop-up asking for the resolution of the image you want to push into the database. Just set the Width and Height as you want and click Ok:
Well done! You have pushed your first item into Ansys Dynamic Reporting. This image will automatically be linked to the dataset gmv_cylinder.case, with a tag "interactive".
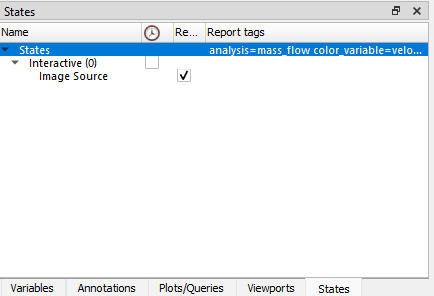
Next, let's recapture the image. However, this time, let's add some tags: "analysis=mass_flow color_variable=velocity". When declaring multiple tags, they must be separated with a space. Here we have defined two tags, "analysis" and "variable", both of which have a value. Go into the States tab at the bottom-left:
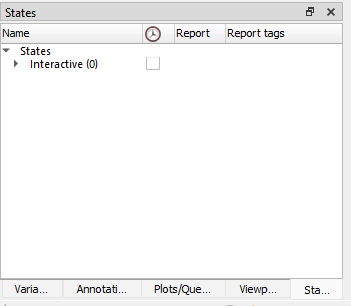
See how you already have a State called "Interactive (0)". This state contains the information about the model analysis at the time you captured the image. Double-click on the Report tags section at the very top, and manually add the tags:
These tags will be associated with any item created by the current EnSight session from now on. Now, right-click on the background of the States panel -> Generate Report
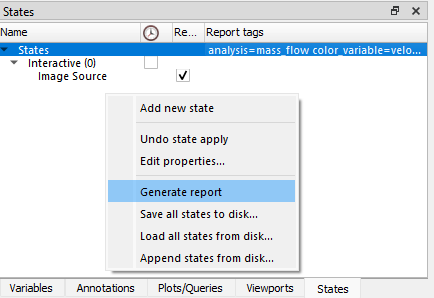
The image is regenerated and resent to the Ansys Dynamic Reporting database, but this image has tags.
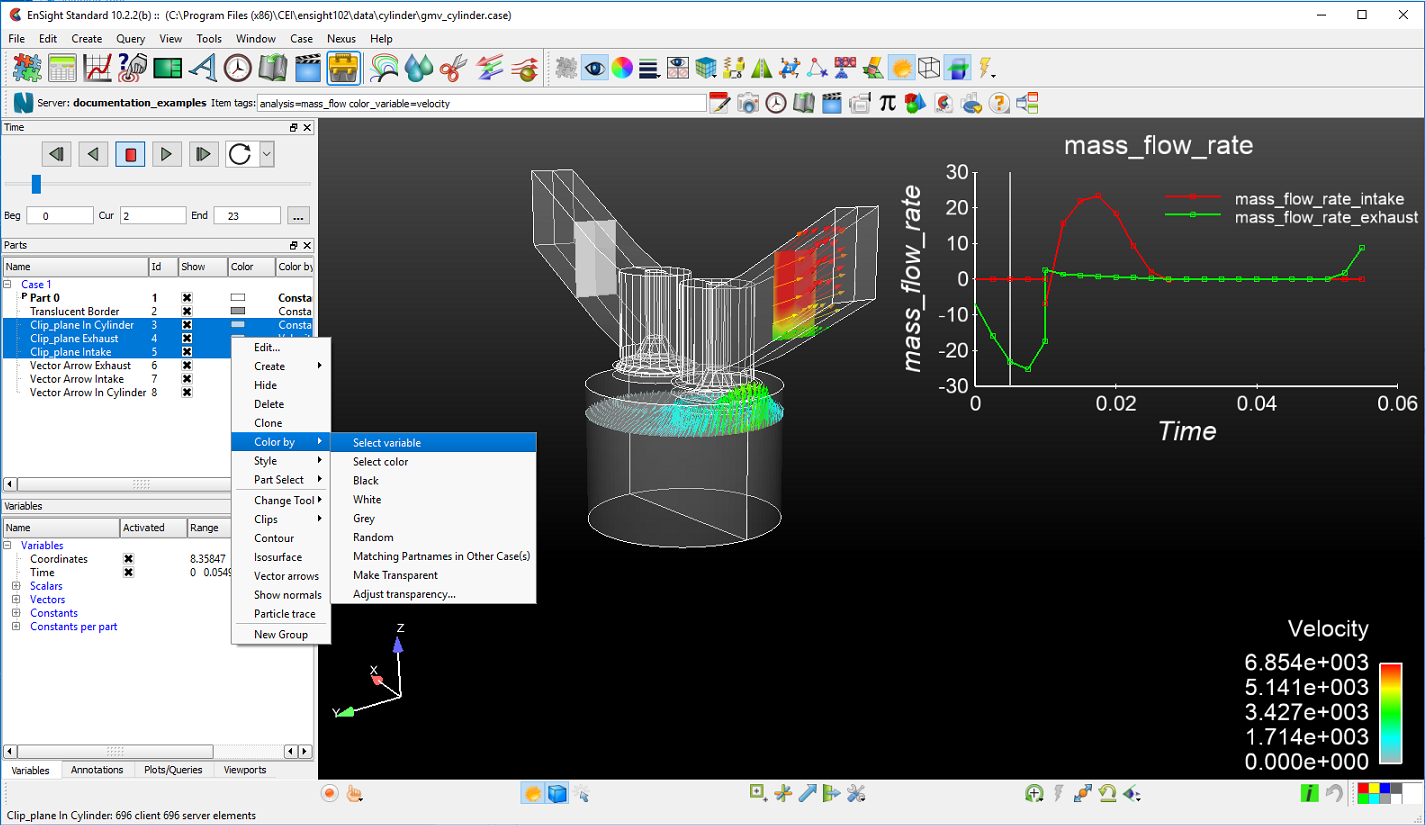
Now select the three parts whose ids are 3,4,& 5. Right click on one of the selected parts, go to Color by -> Select variable, and select the vector variable Velocity.
Right-click anywhere on the viewport background -> Send to report -> 3D scene:
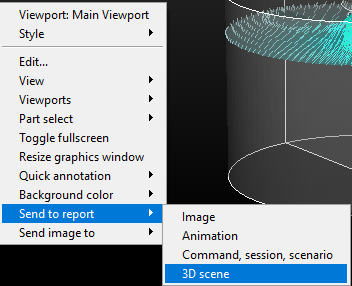
A dialog will pop up asking if you want to record all timesteps. Leave the toggle OFF and click Ok. This will push your 2D and 3D parts at the current timestep into the Ansys Dynamic Reporting database as geometry. Right-click again on the viewport background -> Send image to -> Report. Set the image size and click Ok. A new image with the clip planes colored by Velocity will be saved. Note also that the tags you entered for the previous image push remain on these new Items as well. These tags will facilitate searching for these items later and become much more useful when you push data from multiple sessions working on multiple analyses into Ansys Dynamic Reporting. Right-click on the background of the State panel -> Generate Report to create the Items.
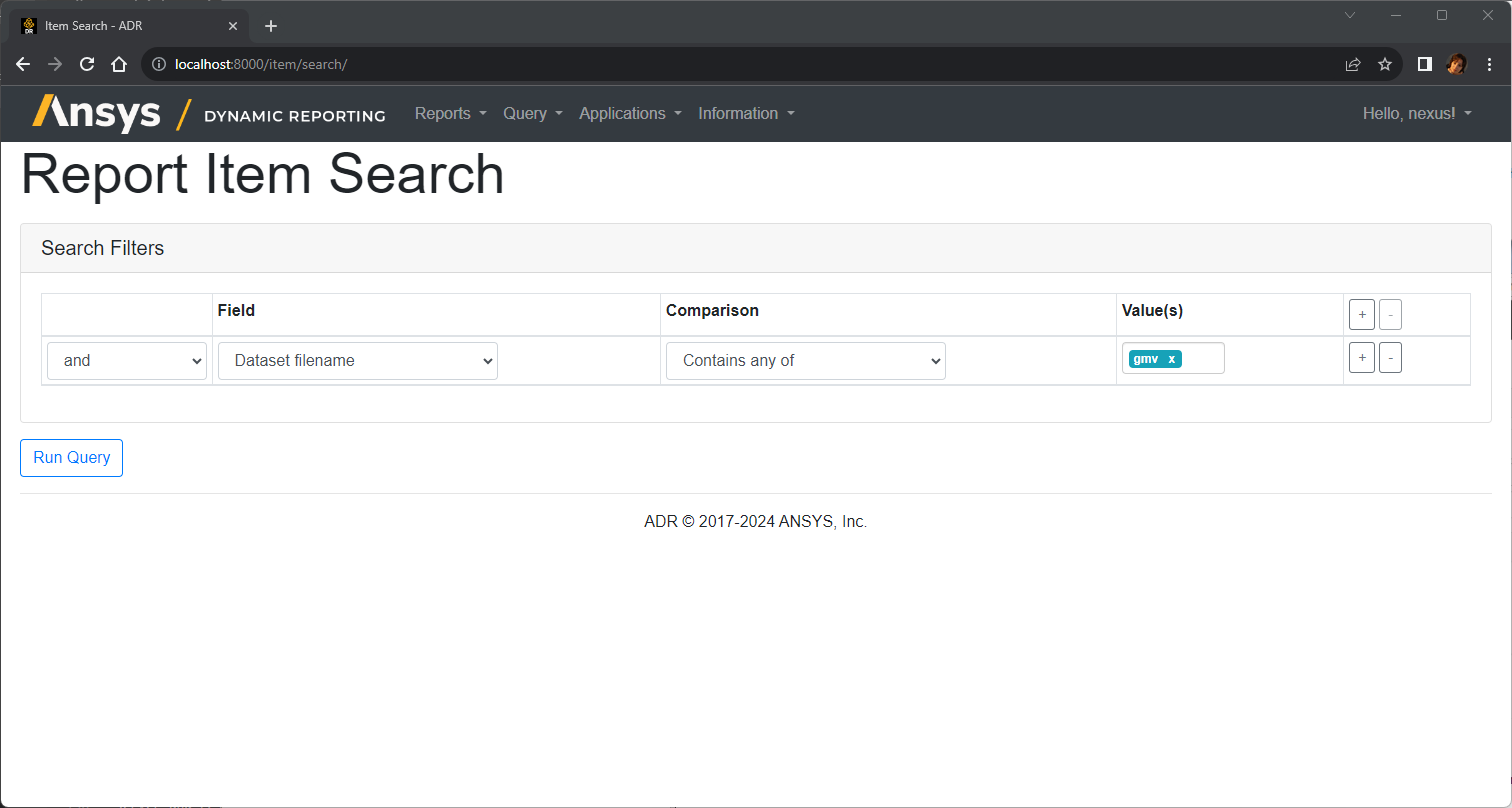
Let's go back into our web browser and look at our Ansys Dynamic Reporting database to see our three Report Items that we just pushed. In the Query section, set the search to be by Dataset filename which contains any of 'gmv', then run the query.
Since the push to Ansys Dynamic Reporting that we did in EnSight automatically recorded the Dataset filename, the result of the search on Dataset filename contains the three Report Items that we have just added, plus a Logo image file.
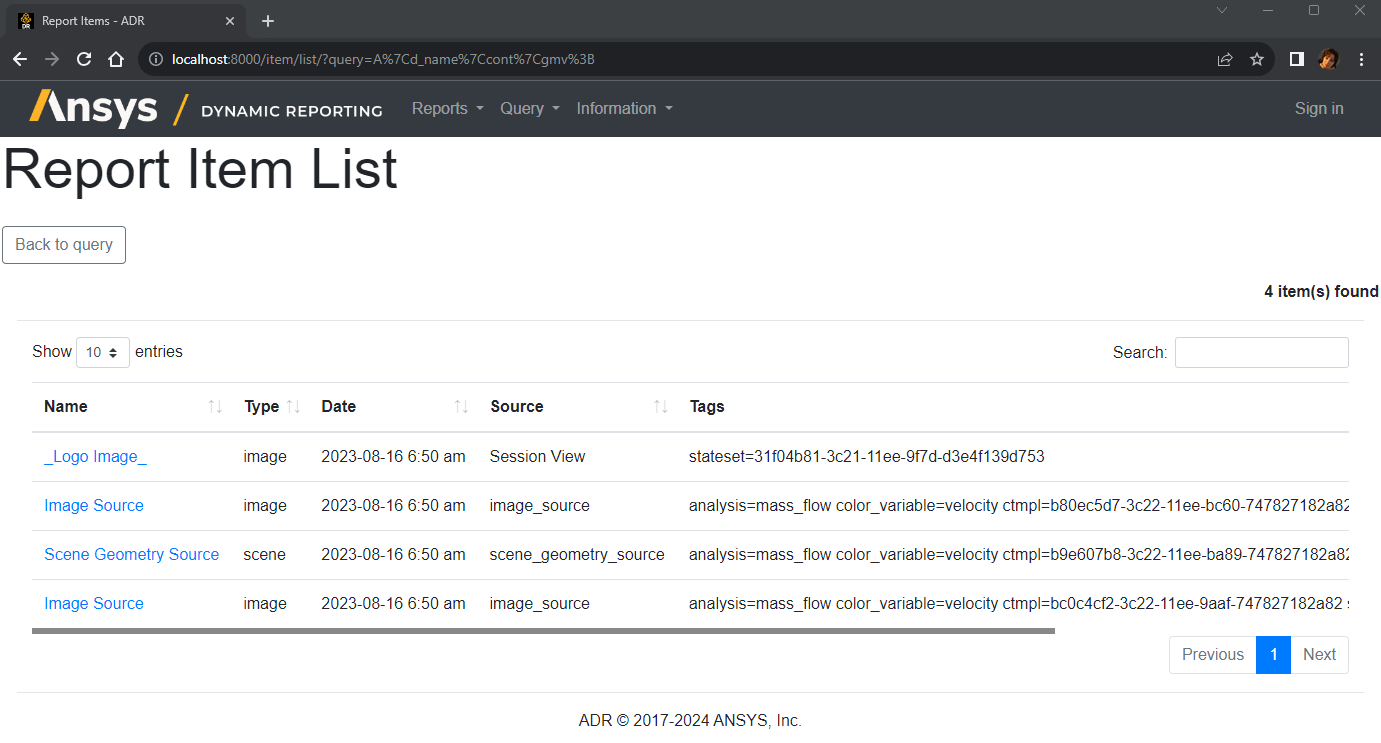
Note how each Item has as tags stateset=....., with a unique GUID that identifies the session of EnSight this items where created from.
This data has been saved into your local database. If you quit the Nexus server and restart it, you will find these Report Items in it.
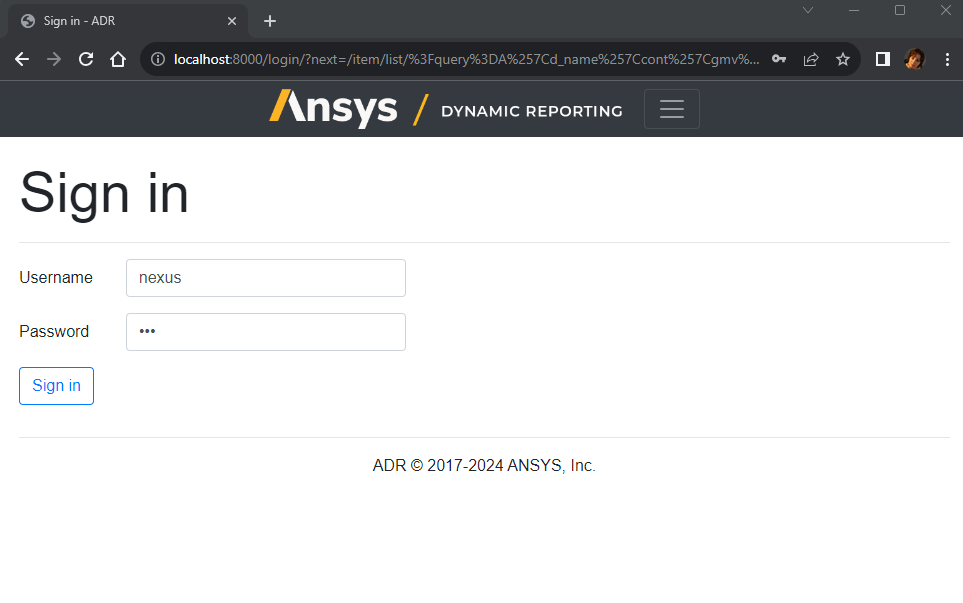
We now want to delete the first image Item from the database. In order to delete data from your dataset, you will need to log in. If you are not logged in, you can search and see data Items, but cannot modify them (add or delete). Click on the Log in button in the top right of your web browser, log in with user name 'nexus' and use the password 'cei'.
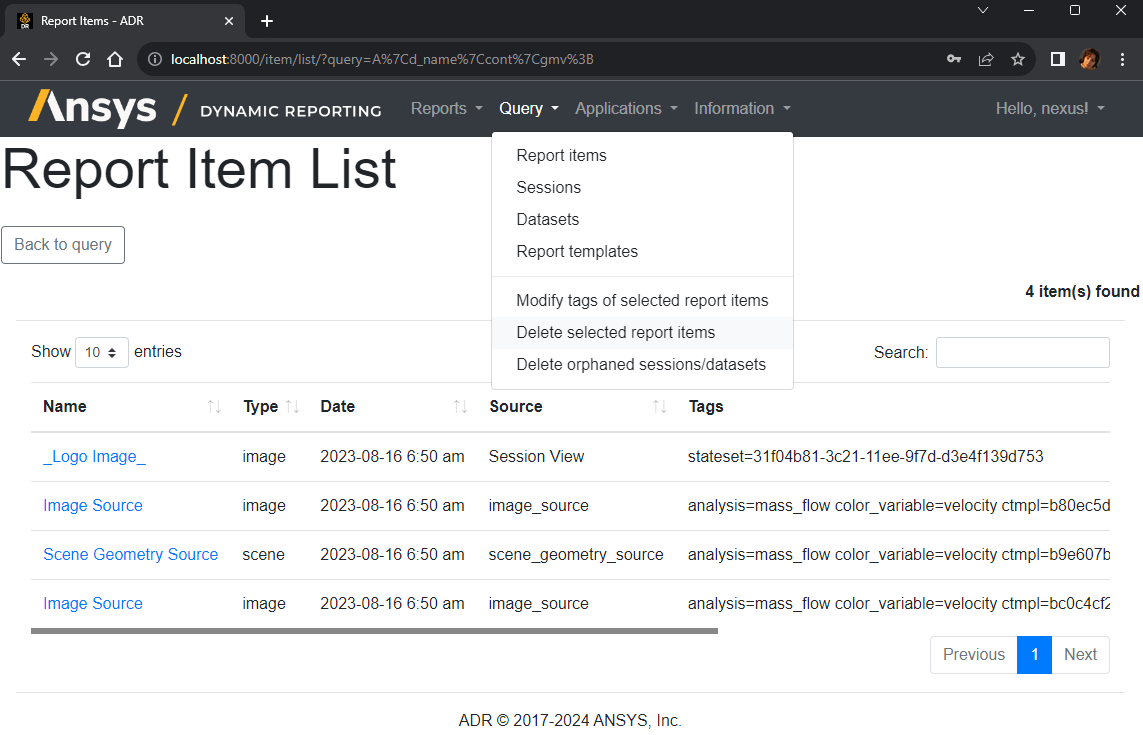
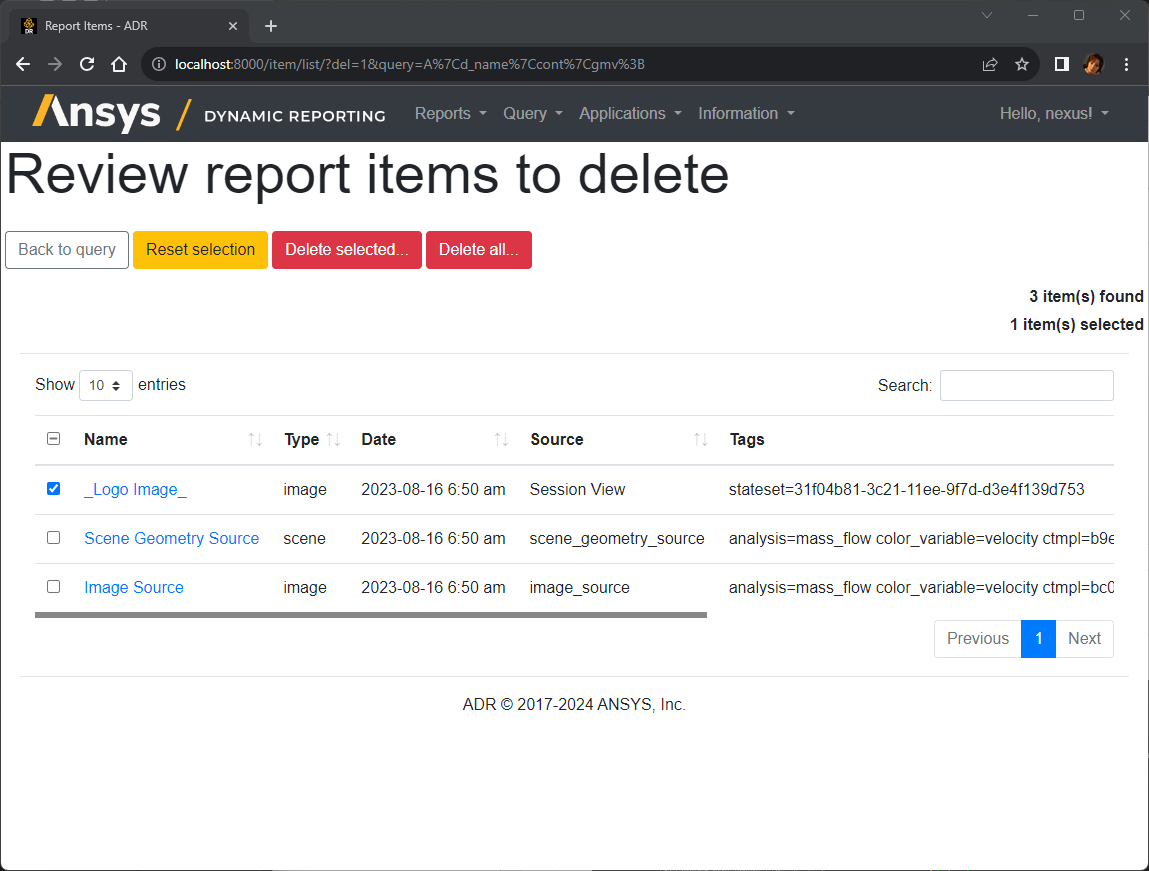
Now, select the "Query" menu. You can see two new options now that you are logged in. Click "Select report items to delete"
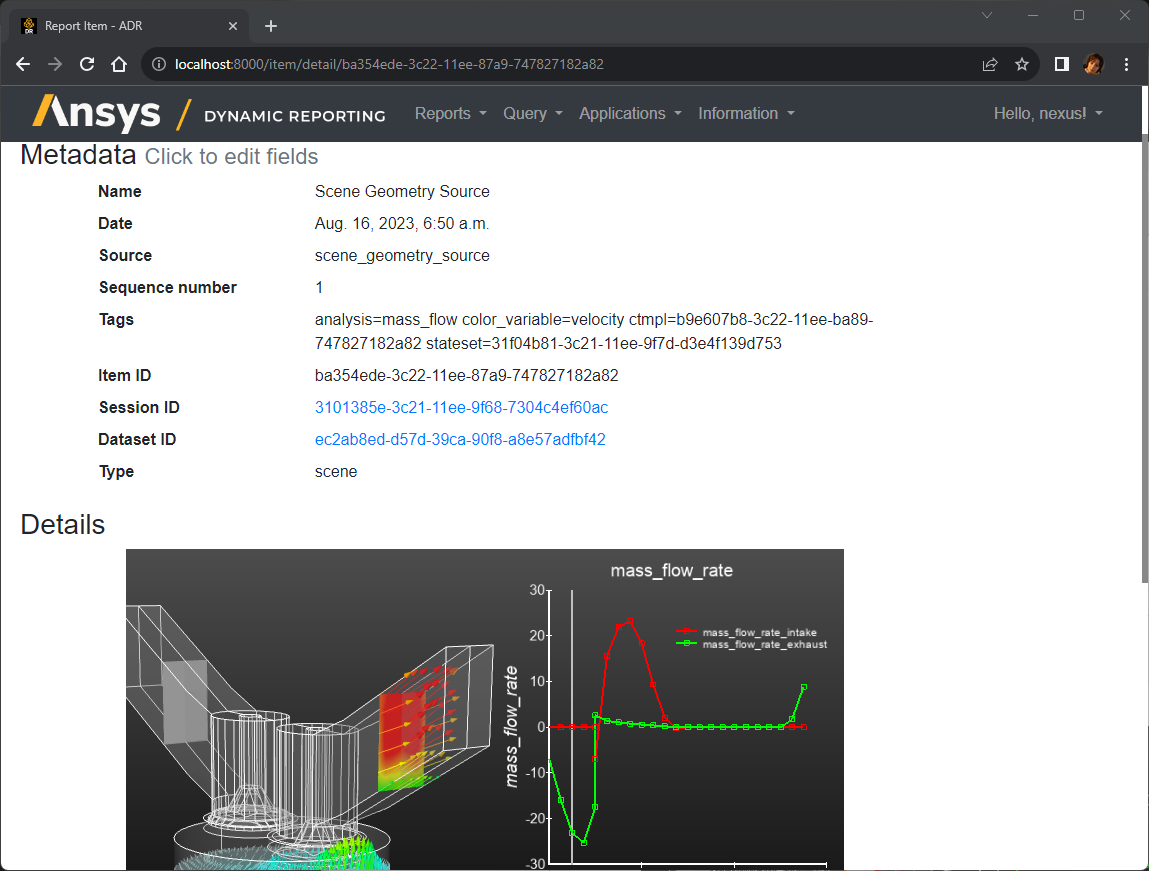
Choose Dataset filename contains any of 'gmv'. Click Run Query. Now you have the same list of Items available. Click on one of the image Items. A page with the Item details and the image will appear
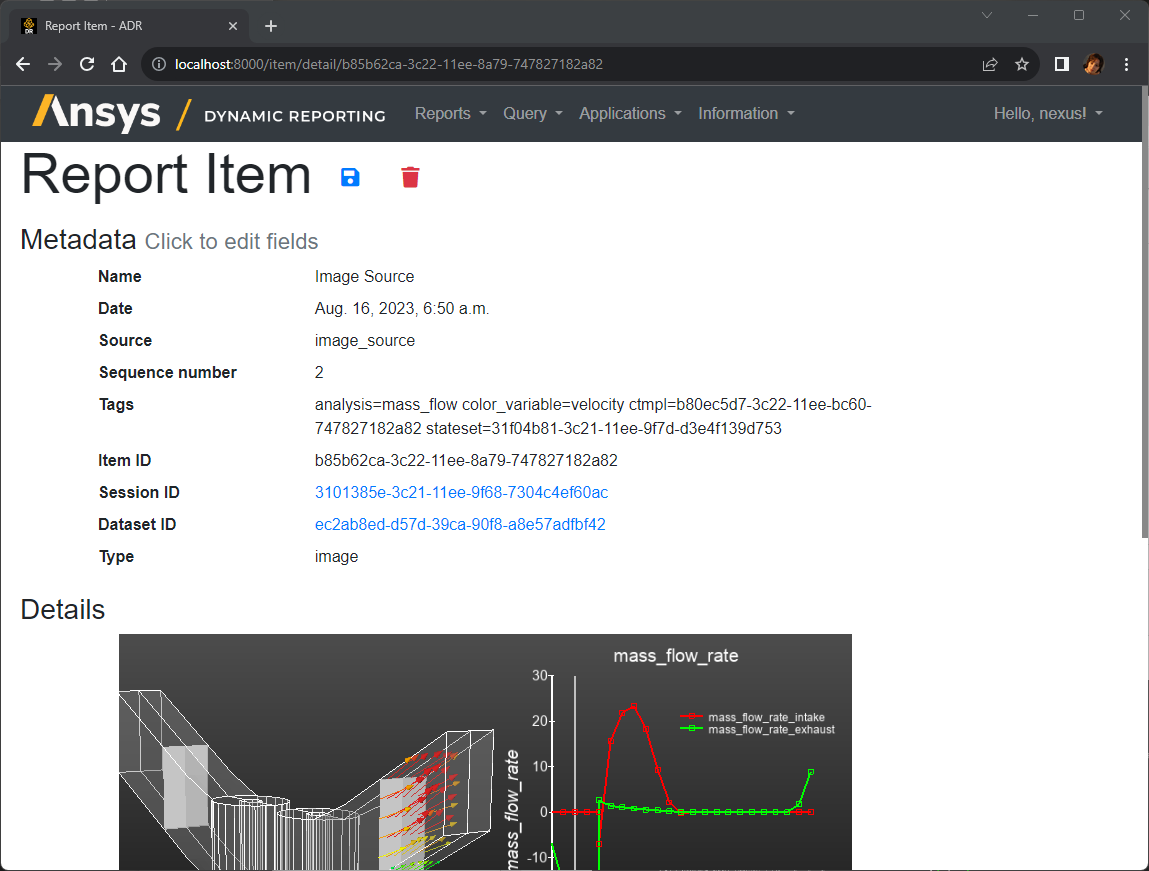
If this is the image corresponding to the clips not colored by the Velocity variable, click on the Delete icon at the top right to delete the image Item from the database. Otherwise, return to the previous page and repeat for the other image Item. Note that also the default Logo image item is queried. We can delete this as well since we don't particularly care for a Logo in our database and report. Select the Logo Item from the list of queried Items. Click on the "Delete selected items" button to permanently remove this report Item from the local database.
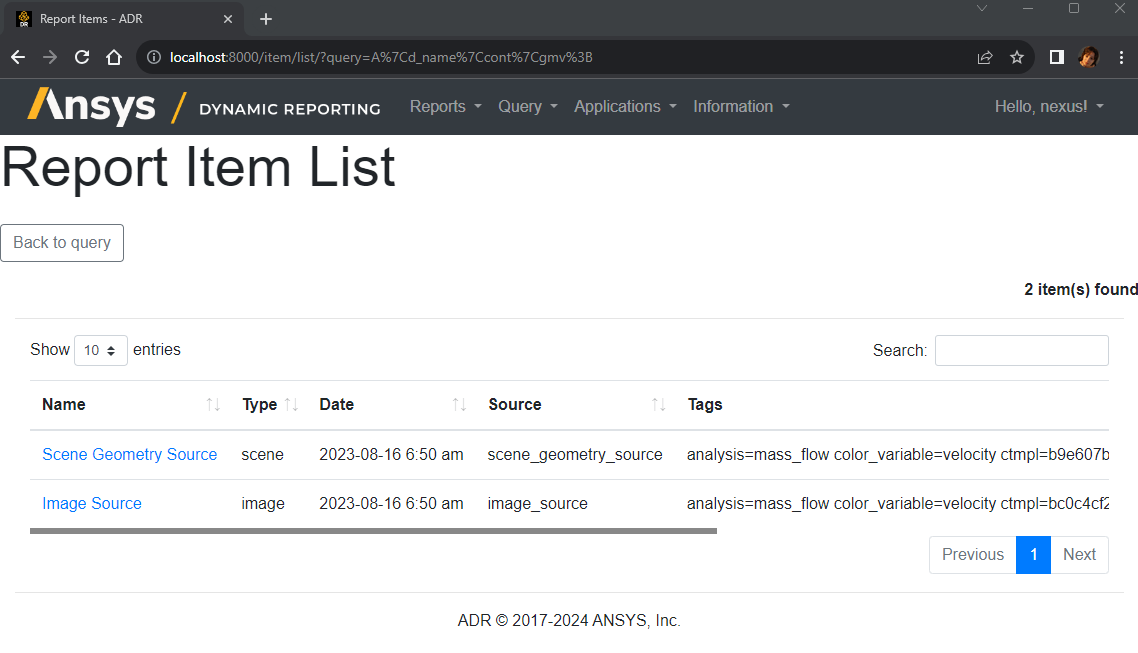
Now let's look at the remaining two report items. Go again into Query>Report Items and redo a query of Dataset filename contains 'gmv'. See the result of the query below.
Click on the image Report Item to see the image displayed.
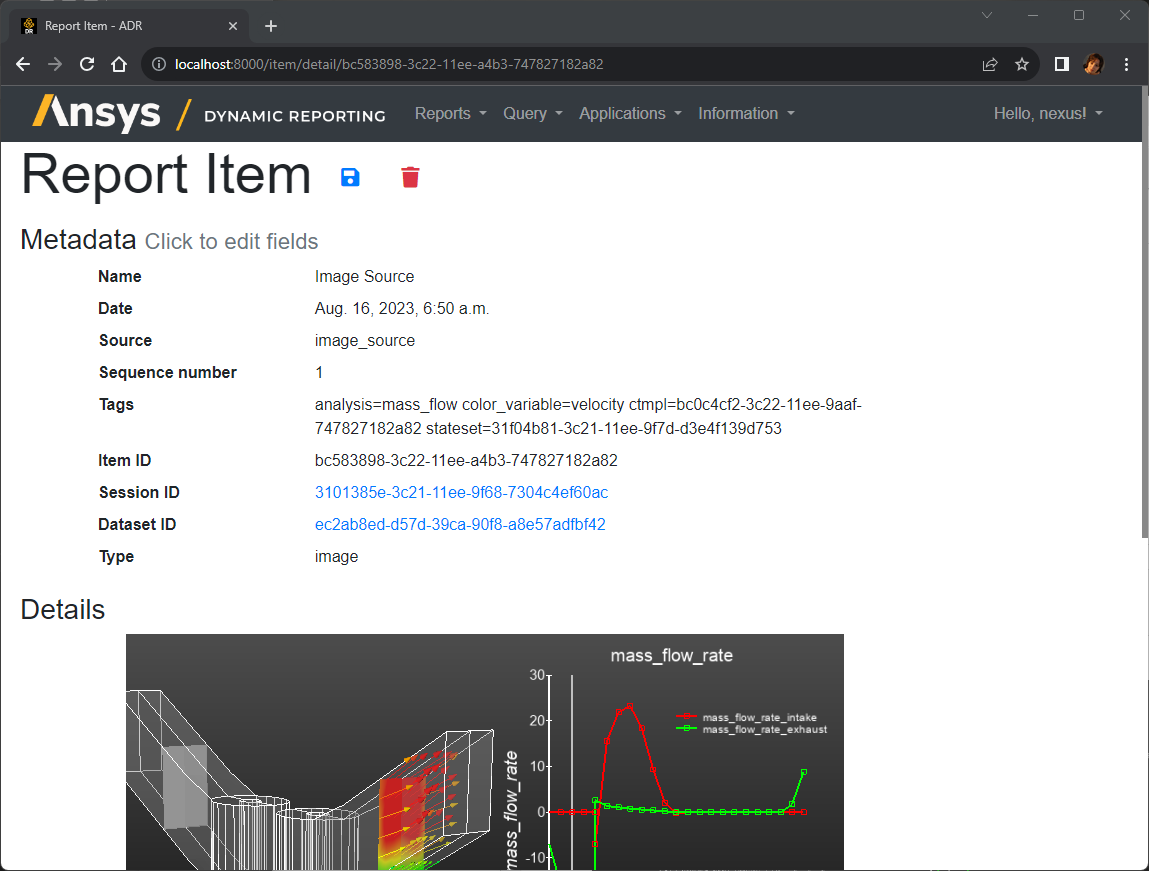
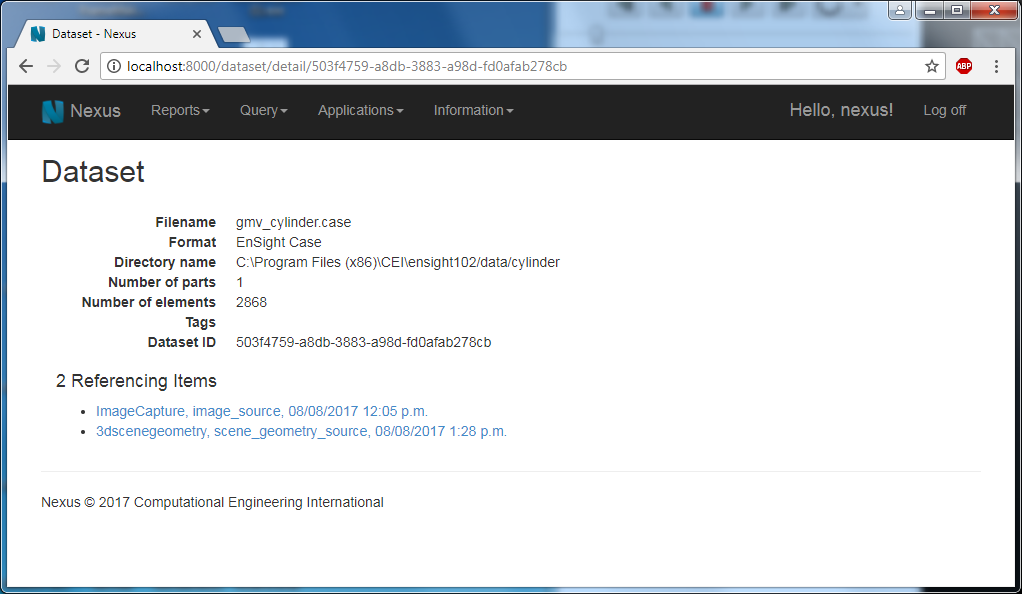
Now click on the dataset ID of this Report Item to open up details about the Dataset. You can see that EnSight automatically populated the dataset filename, the format of the data, the location of the data, total number of parts, and the number of elements.
Click on the web browser back arrow a couple of times to get back to the results of the Search for Report Items in dataset with filename containing 'gmv', and click on the Scene geometry source object (the second item in the list below).
Now you see the 3D report Item. This is not an image. It is the 3D geometry from EnSight and is displayed in Nexus using an interactive web-based renderer. Click and drag your pointer in the graphics window and move the geometry around. This is a highly useful interactive item that can be quite informative when included in a report page (which we will see later).