Generator: Table Value Filter#
The table value generator allows the user to remove rows/columns from a table based on a filter applied to the values in a specific column/row. The generator is applied to every incoming table and produces a new output table for every input table. The filter might be used to only keep rows where the row value in the 'Pressure' column is above 10.0. It could keep only columns where the value in the 4th row is specifically 'OverFlow'.
There are a number of value filters that can be applied. These include:
Range based 'min < value < max' form tests where individual min or max tests can be skipped
Keep the row/column if the value is in the upper/lower N values
Keep the row/column if the value is in the upper/lower X percent of values
Keep the row/column if the value is in a list of specific, valid values
The sense of the test can be inverted, so 'keep' becomes 'reject'.
Configuration options#
There are a few configuration options for this generator. The first is the ability to set the name for the generated table(s). The table name can include macro expansions and will use the current data item to access additional macro sources (e.g. tag values).
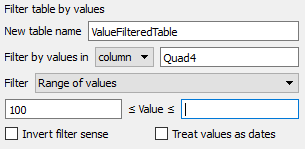
The options allow the filtering operation to be applied to rows or columns by selecting the column or row to scan for values to filter by. In the example above, the generator will filter rows, using values in the column with the label 'Quad4' as the critera. The name of the column (or row) can be the name of the label or a number which is the column or row index into the table (0-based numbering).
The actual filter is selected using the filter pulldown.
Range of values#
As illustrated earlier, the user may enter a lower bound and/or an upper bound. If the value is between or equal to the bounds, it will be kept. If one of the bounds is not specified (left empty), that specific test is not made. In the example, no comparison is made to an upper bound and the row is kept if the value is greater than or equal to 100.
Specific values#
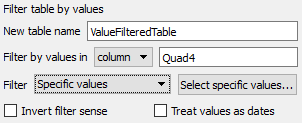
With this filter, the user can click on 'Select specific values...' to enter a list of specific values. If the column value matches any of the values in that list, the row will be preserved.
Upper/Lower % of values#
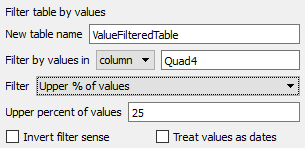
The upper % filter will keep the row if the value in the column is in the upper/lower 25 percent of the values in the column (over all rows).
Upper/Lower # of values#
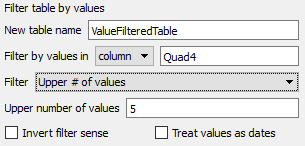
The upper N filter will keep the row if the value in the column is in the upper/lower 5 values in the column (over all rows). Note: if there are at least 5 rows in the table, this filter will return 5 (whatever number is specified) items in all cases. If there are ties (e.g. when ranked, rows 3 though 10 all have the same value), which specific rows from the list of tied rows selected will be random.
The sense of the entire operation can be inverted if 'Invert filter sense' is selected. When checked, the filter will select the rows to remove instead of keep.
In Ansys Dynamic Reporting, it is common to put dates in tables as a double. The double is the number of seconds since midnight, Jan 1, 1970. When filtering a column that consists of such numbers, it can be desirable to enter the limits as date/time values. The 'Treat values as dates' option enables this mode and makes it possible to easily filter a column of dates to a given range.
Example#
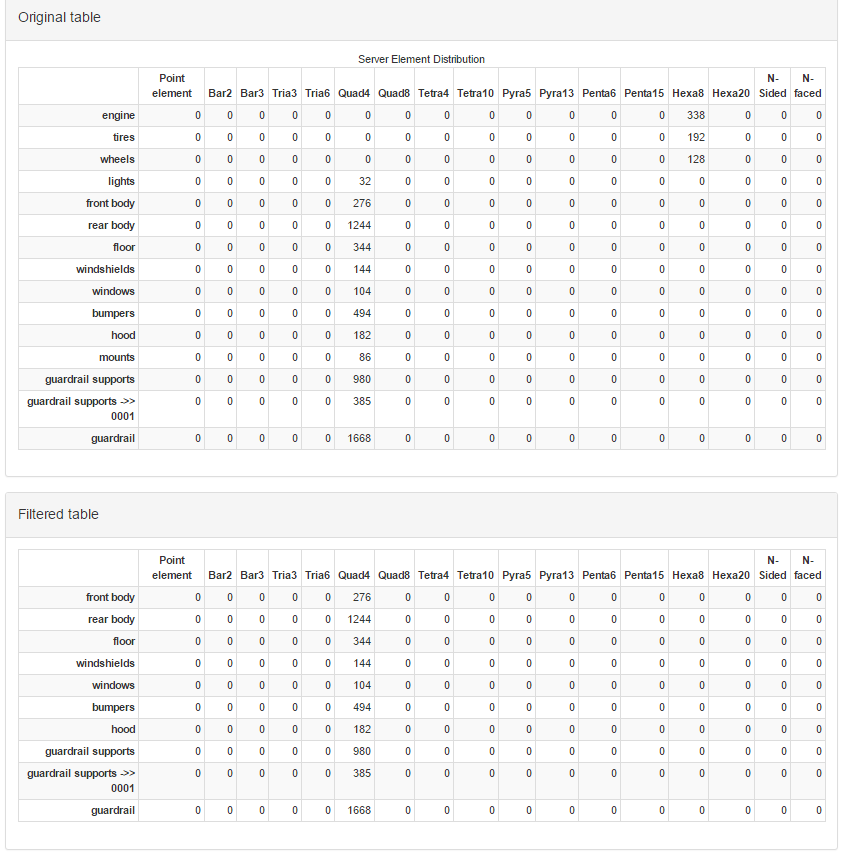
In the following example, the Table Value Filter generator is used to reduce the number of rows in a table. The template layout looks like:
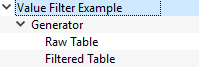
'Value Filter Example' is a simple layout that selects the table to process. The actual generator instance is 'Generator'. It is configured as:
The filter selects the rows to keep using the values in the 'Quad4' column. It only keeps rows with values greater than or equal to 100. The generator merges the new table into the data items list and gives it a specific name: 'ValueFilteredTable'. The 'Raw Table' and 'Filtered Table' templates are panel layouts that filter to the original and generator table items respectively. The resulting report looks like this: