Examples#
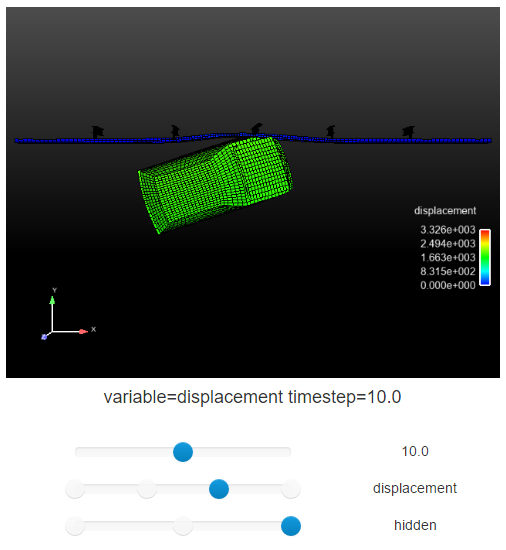
In this example configuration:

the 'image_title' property has been set to:
<h4>variable={{variable}} timestep={{timestep}}</h4>
and the 'show_nodes' property has been set to:
[none,1,1]
Notice the slider value replacement in the title string and the inclusion of nodes for the latter two sliders.
Image comparison examples in the Gallery#
The Ansys Dynamic Reporting gallery contains two examples of image comparison: for normal images, and enhanced images. Start by isolating via the item filter the images for the comparison. In the gallery example database, there are 464 normal images and 16 enhanced images. Let's first isolate the normal images and use them to create a first image comparison.
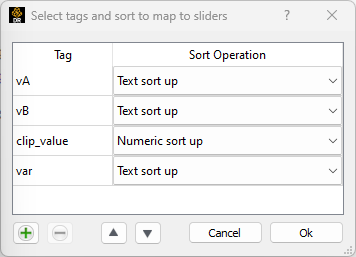
These 464 images contain four tags: vA (2 values), vB (2 values), clip_value (29 values) and var (4 values). These tags will be used as slider values. To set up the image comparison, use a Slider Layout template and set the properties:
image_comparison = 1
image_controls = 1
In the Select tags and sort to map to sliders...., set the following:

These will set the sliders. In the Gallery example, you can control both clip_value and var at the same time for both set of images. This is achieved by setting on the template the property:
common_slider_tags = [clip_value, var]
Finally, to improve the user's visualization, we can set the title to display the tag values for the currently visualized images via the property:
slider_title = [X value: {{clip_value}}, variable: {{var}}, v inlet A: {{vA}},v inlet B: {{vB}}]
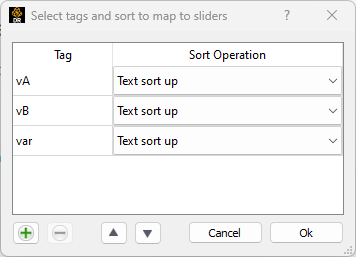
Now let's work with the enhanced images to create a second comparison. Isolate with an item filter the 16 enhanced images. These images contain three tags: vA (2 values), vB (2 values) and var (4 values). Set a Slider Layout template, with the properties:
image_comparison = 1
image_controls = 1
deep_image_comparison = 1
common_slider_tags = [var]
and then, in the Select tags and sort to map to sliders... menu, enter:
